News · 28 September 2026 · 5 min read
Weekly Rents: Darwin Up 12.9% on Last Year - Week Ending 27 September 2026
National advertised rents averaged $767 a week in the week ending 27 September 2026. That is down $1.43 on the previous week and 1.1% lower over four weeks, but still 6.8% higher than a year ago. Darwin leads annual growth at 12.9%. Hobart has the sharpest four-week decline among the capitals, at 1.9%. Houses, units and combined figures each tell a different story.
Rents ease in the short term, but annual growth holds
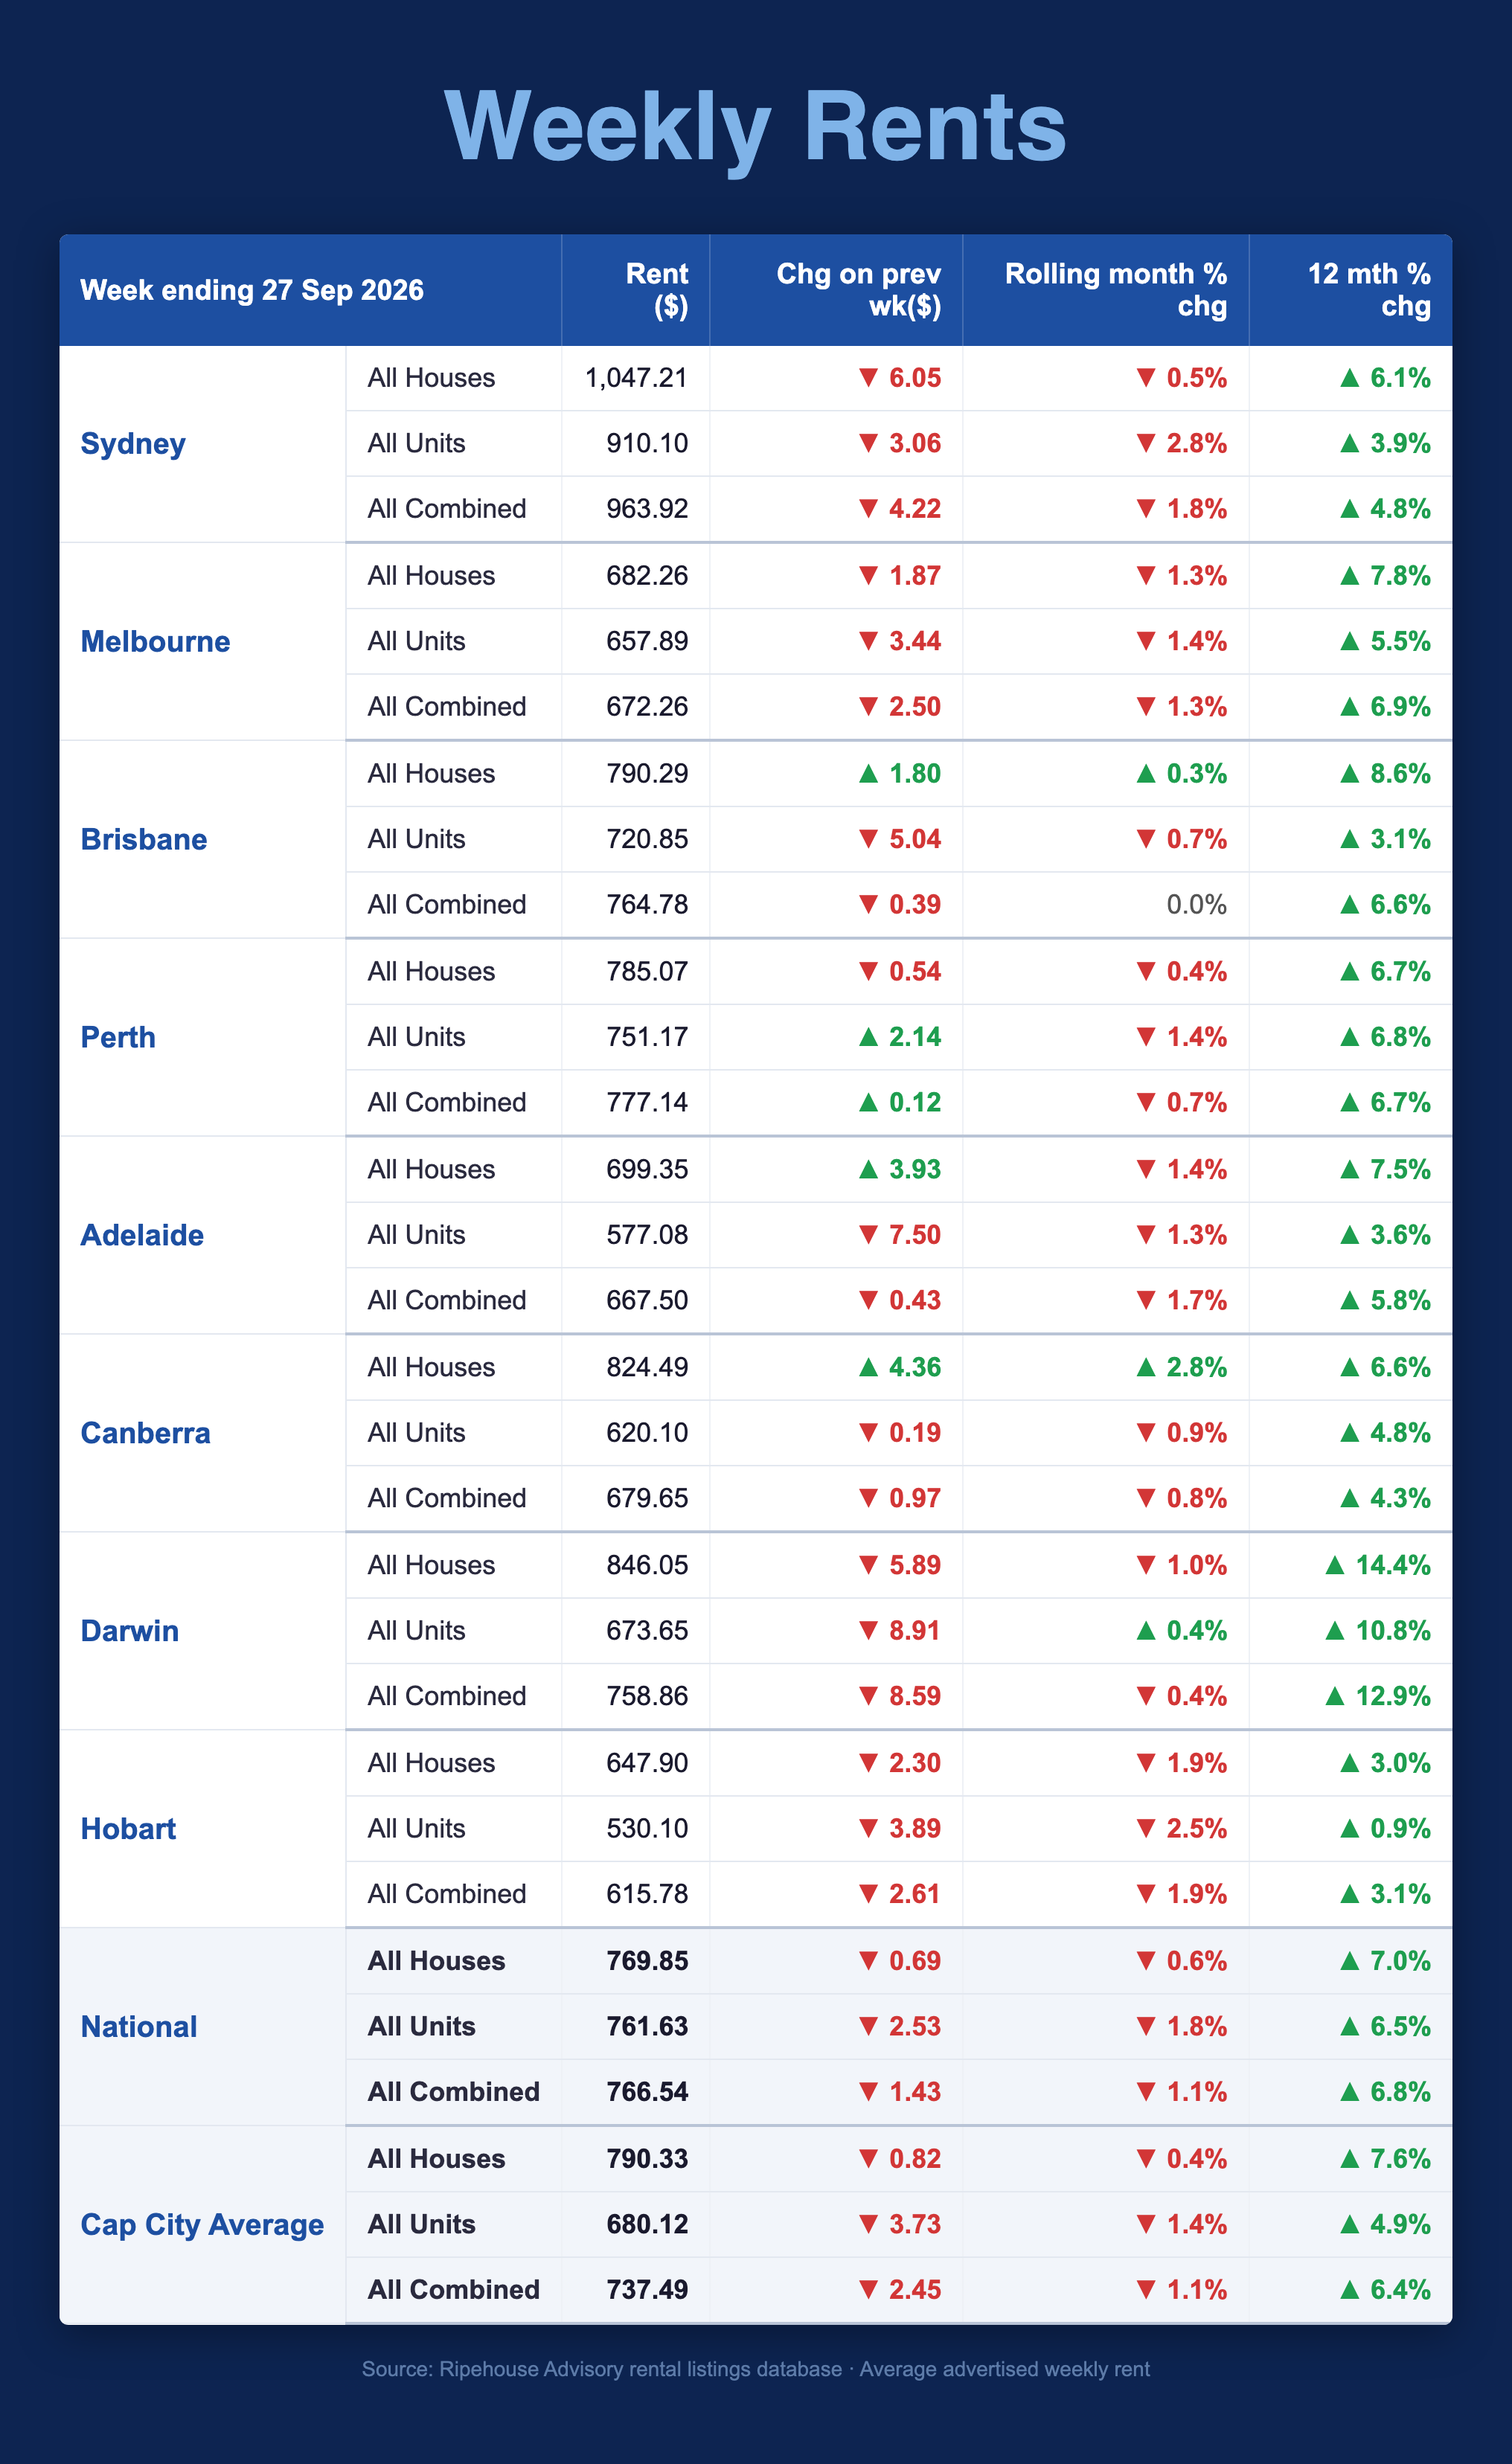
National advertised rents averaged $767 a week in the week ending 27 September 2026. That is down $1.43 on the previous week and 1.1% lower over four weeks. Rents remain 6.8% higher than a year ago.
National houses averaged $770 a week, down $0.69 for the week and up 7.0% over 12 months. National units averaged $762, down $2.53 for the week and up 6.5% annually. The unweighted capital city average for combined dwellings was $737, down $2.45 for the week, down 1.1% over four weeks and up 6.4% over the year.
These figures are aggregate advertised rents. Short-term movement and the annual trend can move in different directions, and neither proves that the rent on an individual property has changed. A falling average can simply reflect a different mix of listings.
How the capital cities compare
Combined asking rents ranged from $616 in Hobart to $964 in Sydney.
- Sydney: Houses averaged $1,047 a week, down $6.05 for the week but up 6.1% annually. Units averaged $910 and are 2.8% lower over four weeks. - Melbourne: The combined average was $672, down 1.3% over four weeks and up 6.9% over the year. Houses are up 7.8% annually. - Brisbane: Houses rose $1.80 to $790 and are up 8.6% over 12 months, the strongest annual house result outside Darwin. Units fell $5.04 to $721. - Perth: The combined average was broadly flat, up $0.12 to $777. Units rose $2.14 to $751. - Adelaide: Houses rose $3.93 to $699. Units fell $7.50 to $577. - Canberra: Houses rose $4.36 to $824 and are up 2.8% over four weeks, the only capital city house market with a four-week rise of that size.
Darwin remains the annual standout. Its combined rent is up 12.9% on a year ago, with houses up 14.4% and units up 10.8%. It also had the largest combined weekly fall, down $8.59 to $759.
Hobart recorded the sharpest four-week combined decline, at 1.9%, and the softest annual growth, at 3.1%. Hobart units are up just 0.9% over 12 months.
Asking-rent deciles: the top end is moving
Across 14,158 first-seen rental observations, the bottom half of the market was flat over four weeks. The median asking rent in each of D1 to D5 was unchanged, from $410 in D1 to $650 in D5.
The rises came in the upper deciles:
- D8 rose 1.22% to $830. - D9 rose 2.15% to $950. - D10 had the largest movement, up 3.85% from $1,300 to $1,350.
This new-listing median series is different from the available-stock city averages above. It reduces the effect of extreme listings, but it does not remove changes in the listing mix.
Gross-yield proxies
The independent-rank gross-yield proxy ranged from 5.51% in D1 to 3.39% in D10. Every band moved lower over the four-week comparison, by between 0.05 and 0.38 percentage points. D1 had the largest drop, from 5.90% to 5.51%.
The proxy is calculated as mean weekly asking rent × 52 ÷ mean sold price in the same rank. It is not property-matched and not net. It excludes vacancy, costs, finance and capital gains. Treat it as a screening prompt only.
Where rental listings are concentrated
Of the 14,158 first-seen listings, 13,941 (98.5%) were matched to an LGA, across 361 LGAs. The five LGAs with the most listings were:
- Brisbane (C): 983 listings, a 7.0% share, at a median of $730 a week - Gold Coast (C): 450 listings at a median of $870 - Sydney (C): 393 listings at a median of $950 - Melbourne (C): 319 listings at a median of $680 - Moreton Bay (R): 316 listings at a median of $680
These counts measure rental listing activity, not sales. A high-volume LGA shows where listings appeared. It is not a recommendation or proof of future growth.
What this means
For investors, the main point is that annual rent growth is still positive while short-term asking rents are softening in most capitals. Before you rely on a rent figure, check comparable listings for the exact street and dwelling type. Then allow for vacancy, management, maintenance and finance, and compare the expected net cash flow with the purchase price.
Houses and units are moving differently in several cities, including Brisbane, Adelaide and Canberra. Assess each property on its own dwelling type. The city table, deciles, yield proxies and LGA data work best together as screening signals, not as a buy list.
If you want clarity on your next move, a free 15-minute Investor Decision Review lets you talk through your income, equity, goals and time horizon, get straight answers, and decide whether structured advisory makes sense for you.
Source: Ripehouse Advisory rental listings database, recorded sales and rental-LGA context. Data can be revised. General information only, not personal financial advice.
The full data — week ending 27 September 2026
| City | Dwelling | Avg Weekly Rent | Chg on Prev Wk | Rolling Mth | Chg 12 Mth |
|---|---|---|---|---|---|
| Sydney | All Houses | $1047.21 | -$6.05 | -0.5% | +6.1% |
| Sydney | All Units | $910.10 | -$3.06 | -2.8% | +3.9% |
| Sydney | All Combined | $963.92 | -$4.22 | -1.8% | +4.8% |
| Melbourne | All Houses | $682.26 | -$1.87 | -1.3% | +7.8% |
| Melbourne | All Units | $657.89 | -$3.44 | -1.4% | +5.5% |
| Melbourne | All Combined | $672.26 | -$2.50 | -1.3% | +6.9% |
| Brisbane | All Houses | $790.29 | +$1.80 | +0.3% | +8.6% |
| Brisbane | All Units | $720.85 | -$5.04 | -0.7% | +3.1% |
| Brisbane | All Combined | $764.78 | -$0.39 | 0.0% | +6.6% |
| Perth | All Houses | $785.07 | -$0.54 | -0.4% | +6.7% |
| Perth | All Units | $751.17 | +$2.14 | -1.4% | +6.8% |
| Perth | All Combined | $777.14 | +$0.12 | -0.7% | +6.7% |
| Adelaide | All Houses | $699.35 | +$3.93 | -1.4% | +7.5% |
| Adelaide | All Units | $577.08 | -$7.50 | -1.3% | +3.6% |
| Adelaide | All Combined | $667.50 | -$0.43 | -1.7% | +5.8% |
| Canberra | All Houses | $824.49 | +$4.36 | +2.8% | +6.6% |
| Canberra | All Units | $620.10 | -$0.19 | -0.9% | +4.8% |
| Canberra | All Combined | $679.65 | -$0.97 | -0.8% | +4.3% |
| Darwin | All Houses | $846.05 | -$5.89 | -1.0% | +14.4% |
| Darwin | All Units | $673.65 | -$8.91 | +0.4% | +10.8% |
| Darwin | All Combined | $758.86 | -$8.59 | -0.4% | +12.9% |
| Hobart | All Houses | $647.90 | -$2.30 | -1.9% | +3.0% |
| Hobart | All Units | $530.10 | -$3.89 | -2.5% | +0.9% |
| Hobart | All Combined | $615.78 | -$2.61 | -1.9% | +3.1% |
| National | All Houses | $769.85 | -$0.69 | -0.6% | +7.0% |
| National | All Units | $761.63 | -$2.53 | -1.8% | +6.5% |
| National | All Combined | $766.54 | -$1.43 | -1.1% | +6.8% |
| Cap City Average | All Houses | $790.33 | -$0.82 | -0.4% | +7.6% |
| Cap City Average | All Units | $680.12 | -$3.73 | -1.4% | +4.9% |
| Cap City Average | All Combined | $737.49 | -$2.45 | -1.1% | +6.4% |
Average advertised weekly rent across all listings available during the week, Ripehouse Advisory rental listings database. Week runs Monday to Sunday; capital cities defined by GCCSA boundaries.
General information only. It does not take your objectives, financial situation or needs into account, and nothing here is legal, financial, taxation or investment advice specific to your circumstances.