News · 23 October 2026 · 5 min read
One SA suburb's median fell $570,000. Adelaide's fell $25,000. Which tells you more?
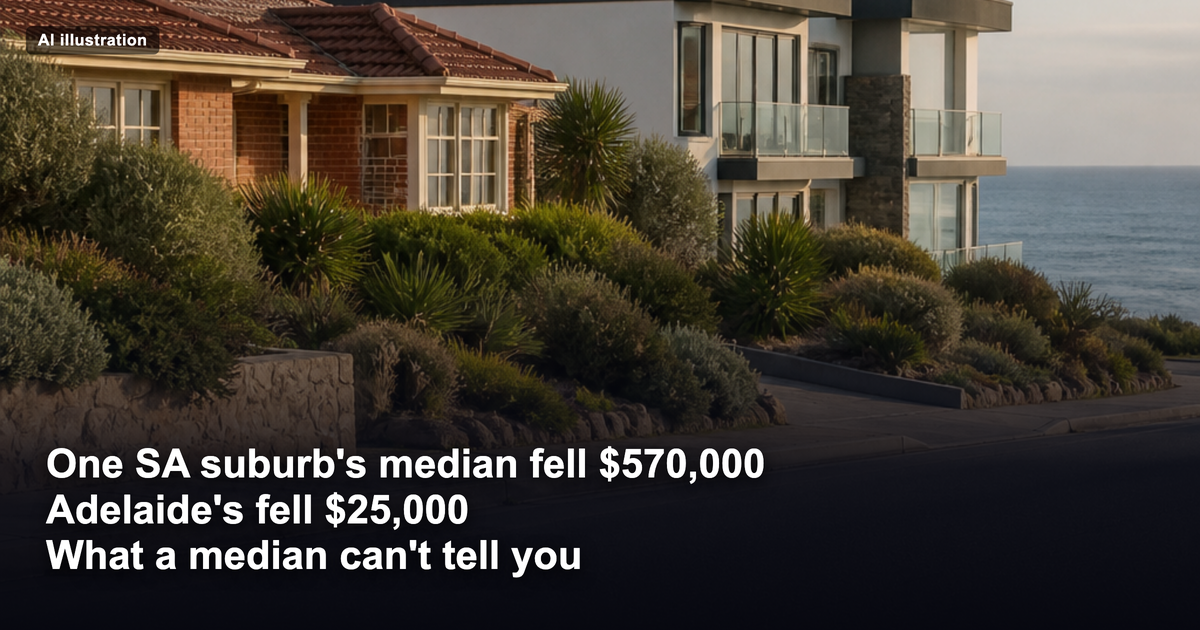
One South Australian suburb's median house value fell $570,000 over the past year, according to the Valuer-General's latest quarterly figures, reported by realestate.com.au on 23 October 2026. In the same report, another suburb's median rose $355,000, and Adelaide's overall house median slipped $25,000 in three months.
If you own in South Australia, or you have equity and are thinking of buying there, these figures feel very different depending on which one you read first. Before any of them shape a decision, it helps to know what they can and cannot tell you.
What the third-quarter figures show
The Valuer-General's report for the third quarter of 2026 recorded:
- Adelaide median house value: down 2.56 per cent, or $25,000, from $975,000 to $950,000 over the quarter
- State median house value: down 2.1 per cent, or $18,622, from $888,000 to $869,378
- Metro unit median: up 0.71 per cent, or $5,000, from $705,000 to $710,000
- Sales: 5,488 for the quarter, 1,229 fewer than the previous quarter's 6,717 and 817 fewer than the 6,305 recorded in the same quarter of 2025
The biggest dollar fall was in Somerton Park, where the median house value is 24.05 per cent, or $570,000, lower than a year ago. The report doesn't say how many sales sat behind that figure.
At the other end of the table, realestate.com.au looked only at suburbs with at least 10 sales in both this quarter and the same quarter last year. It describes that as the number of transactions needed for a statistically reliable median. Among those suburbs, Port Noarlunga South recorded the highest growth. Its median house value rose 52.59 per cent, or $355,000, from $675,000 to $1.03m, based on 22 sales last quarter and 28 in the third quarter of 2025. The report also listed Blair Athol, up 45.51 per cent or $410,500 to a $1.3125m median, and Wynn Vale, up 35.14 per cent or $294,250 to $1.1315m.
Real Estate Institute of South Australia chief executive Andrea Heading described a market that is "moderating, not retreating". She said annual growth "remains solid across metropolitan, outer-suburban and regional markets".
Why a $570,000 swing rarely tells you about one home
A median is the middle sale in a sorted list. It describes the homes that happened to sell in a period and says nothing about the homes that didn't. When only a few dozen properties change hands, a change in what sold can move that middle figure a long way, even if no individual home's value moved much.
Here is a simple, illustrative example.
Assumptions: a coastal suburb records 11 house sales in each of two periods. In the first period, six are older homes that sell for under $700,000 and five are beachfront homes that sell for over $1m. In the second period it's the other way around: five older homes under $700,000 and six beachfront homes over $1m. Every home is assumed to be worth exactly what it was worth a year earlier.
- First period: the middle (sixth) sale is an older home, so the median is under $700,000
- Second period: the middle (sixth) sale is a beachfront home, so the median is over $1m
Swapping one older-home sale for one beachfront sale moved the median by more than $300,000, and no home changed value. The same thing can happen in reverse. So when one suburb's median falls $570,000, the first questions to ask are how many sales sat behind it and what kind of homes they were.
Port Noarlunga South cleared the 10-sale threshold, and its median still rose 52.59 per cent in a year. Twenty-two sales gives you a more reliable figure than five, but it is still a small sample for a whole suburb. A local selling agent told realestate.com.au she would "absolutely expect that growth to continue". That is a forecast from someone who sells property in the area, so read it as a forecast.
Sales volume matters too. There were 1,229 fewer sales statewide than in the previous quarter, so many medians now rest on fewer transactions. That leaves more room for the mix of homes sold to drive the result.
Houses and units are moving apart
For most owners and buyers, the more useful signal is in the larger numbers. Adelaide's house median fell $25,000 over the quarter while the metro unit median rose $5,000. Both figures draw on far more sales than any single suburb, so one quarter's mix moves them less.
Ms Heading linked the strength in units to affordability: "As detached housing affordability becomes more challenging, well-located apartments and units are playing a larger role in helping buyers access established metropolitan areas."
One quarter doesn't make a trend. Quarterly medians can shift with the season and with whatever happens to come onto the market. If you are weighing a house against a unit in Adelaide, treat this as something to watch, not as a settled answer. A unit that held its value better this quarter can still differ from a house on land content, strata costs, rental demand and long-run growth. A median shows none of those.
What to check before a median shapes your decision
If you own in SA, a fall in your suburb's median doesn't tell you what your property would sell for. Recent sales of homes like yours, on streets like yours, will tell you far more.
If you are buying, treat extreme suburb moves in either direction with the same caution. A 52.59 per cent rise can look like momentum and a $570,000 fall can look like a warning. Either may say more about which homes sold than about where values are heading.
Questions worth asking:
- How many sales sit behind this median, and are there at least 10 in both periods being compared?
- What type of property sold: beachfront, renovated, original condition, large block?
- Is the figure quarterly or annual, and does the comparison use the same periods?
- What have comparable homes sold for on the specific streets you're considering?
- Does buying now suit your cashflow and borrowing position, or would waiting for clearer data cost you less?
It is reasonable to decide the data isn't clear enough yet. With sales volumes down and houses and units moving in different directions, waiting for another quarter of figures can be the sensible choice for some buyers.
Testing your own decision
If you are weighing an SA purchase, or trying to work out what a fall in your suburb's median means for your plans, you can have that decision tested against street-level evidence through our Investor Decision Review.
If there's a specific street you're weighing up right now, check its Street Score first — it's free, takes ten seconds, and tells you whether that street is pulling the suburb average up or riding on it.
Market data & R-Scores for locations in this article
Drill Down Into the Markets Mentioned Above
Inspect live monthly R-Scores, median prices, rental yields, and street-by-street scores for the cities and council areas referenced in this article:
Frequently asked questions
One SA suburb's median fell $570,000. Adelaide's fell $25,000. Which tells you more?
One South Australian suburb's median house value fell $570,000 over the past year, according to the Valuer-General's latest quarterly figures, reported by realestate.com.au on 23 October 2026. In the same report, another suburb's median rose $355,000, and Adelaide's overall house median slipped $25,000 in three months. The biggest dollar fall was in Somerton Park, where the median house value is 24.05 per cent, or $570,000, lower than a year ago. The report doesn't say how many sales sat behind that figure.
What does this mean for Australian property investors with usable equity or cash?
Real Estate Institute of South Australia chief executive Andrea Heading described a market that is "moderating, not retreating". She said annual growth "remains solid across metropolitan, outer-suburban and regional markets". Ripehouse Advisory recommends stress-testing borrowing buffers first and selecting individual suburbs and streets on objective data rather than macro headlines.
How can I check the Suburb R-Score and Street Score for Adelaide (SA)?
Use Ripehouse Advisory’s free research tools at ripehouseadvisory.com.au/locations, /suburbs, and /streets to inspect the monthly 27-indicator R-Score, median house price, rental yield, vacancy rate, and ABS SA1 census street scores for Adelaide (SA).
General information only. It does not take your objectives, financial situation or needs into account, and nothing here is legal, financial, taxation or investment advice specific to your circumstances.