News · 17 August 2026 · 4 min read
Weekly Rents: National Up, Capitals Split — Week Ending 16 August 2026
National advertised weekly rents rose $2.85 to $776.53 in the week ending 16 August 2026 — up 7.3% on a year ago — while the Cap City Average slipped $0.32. Sydney houses now average $1,062.02, Darwin is the only capital with double-digit annual growth in both segments, and Melbourne units have converged to within $20 of houses. Full data inside.
(~600 words)
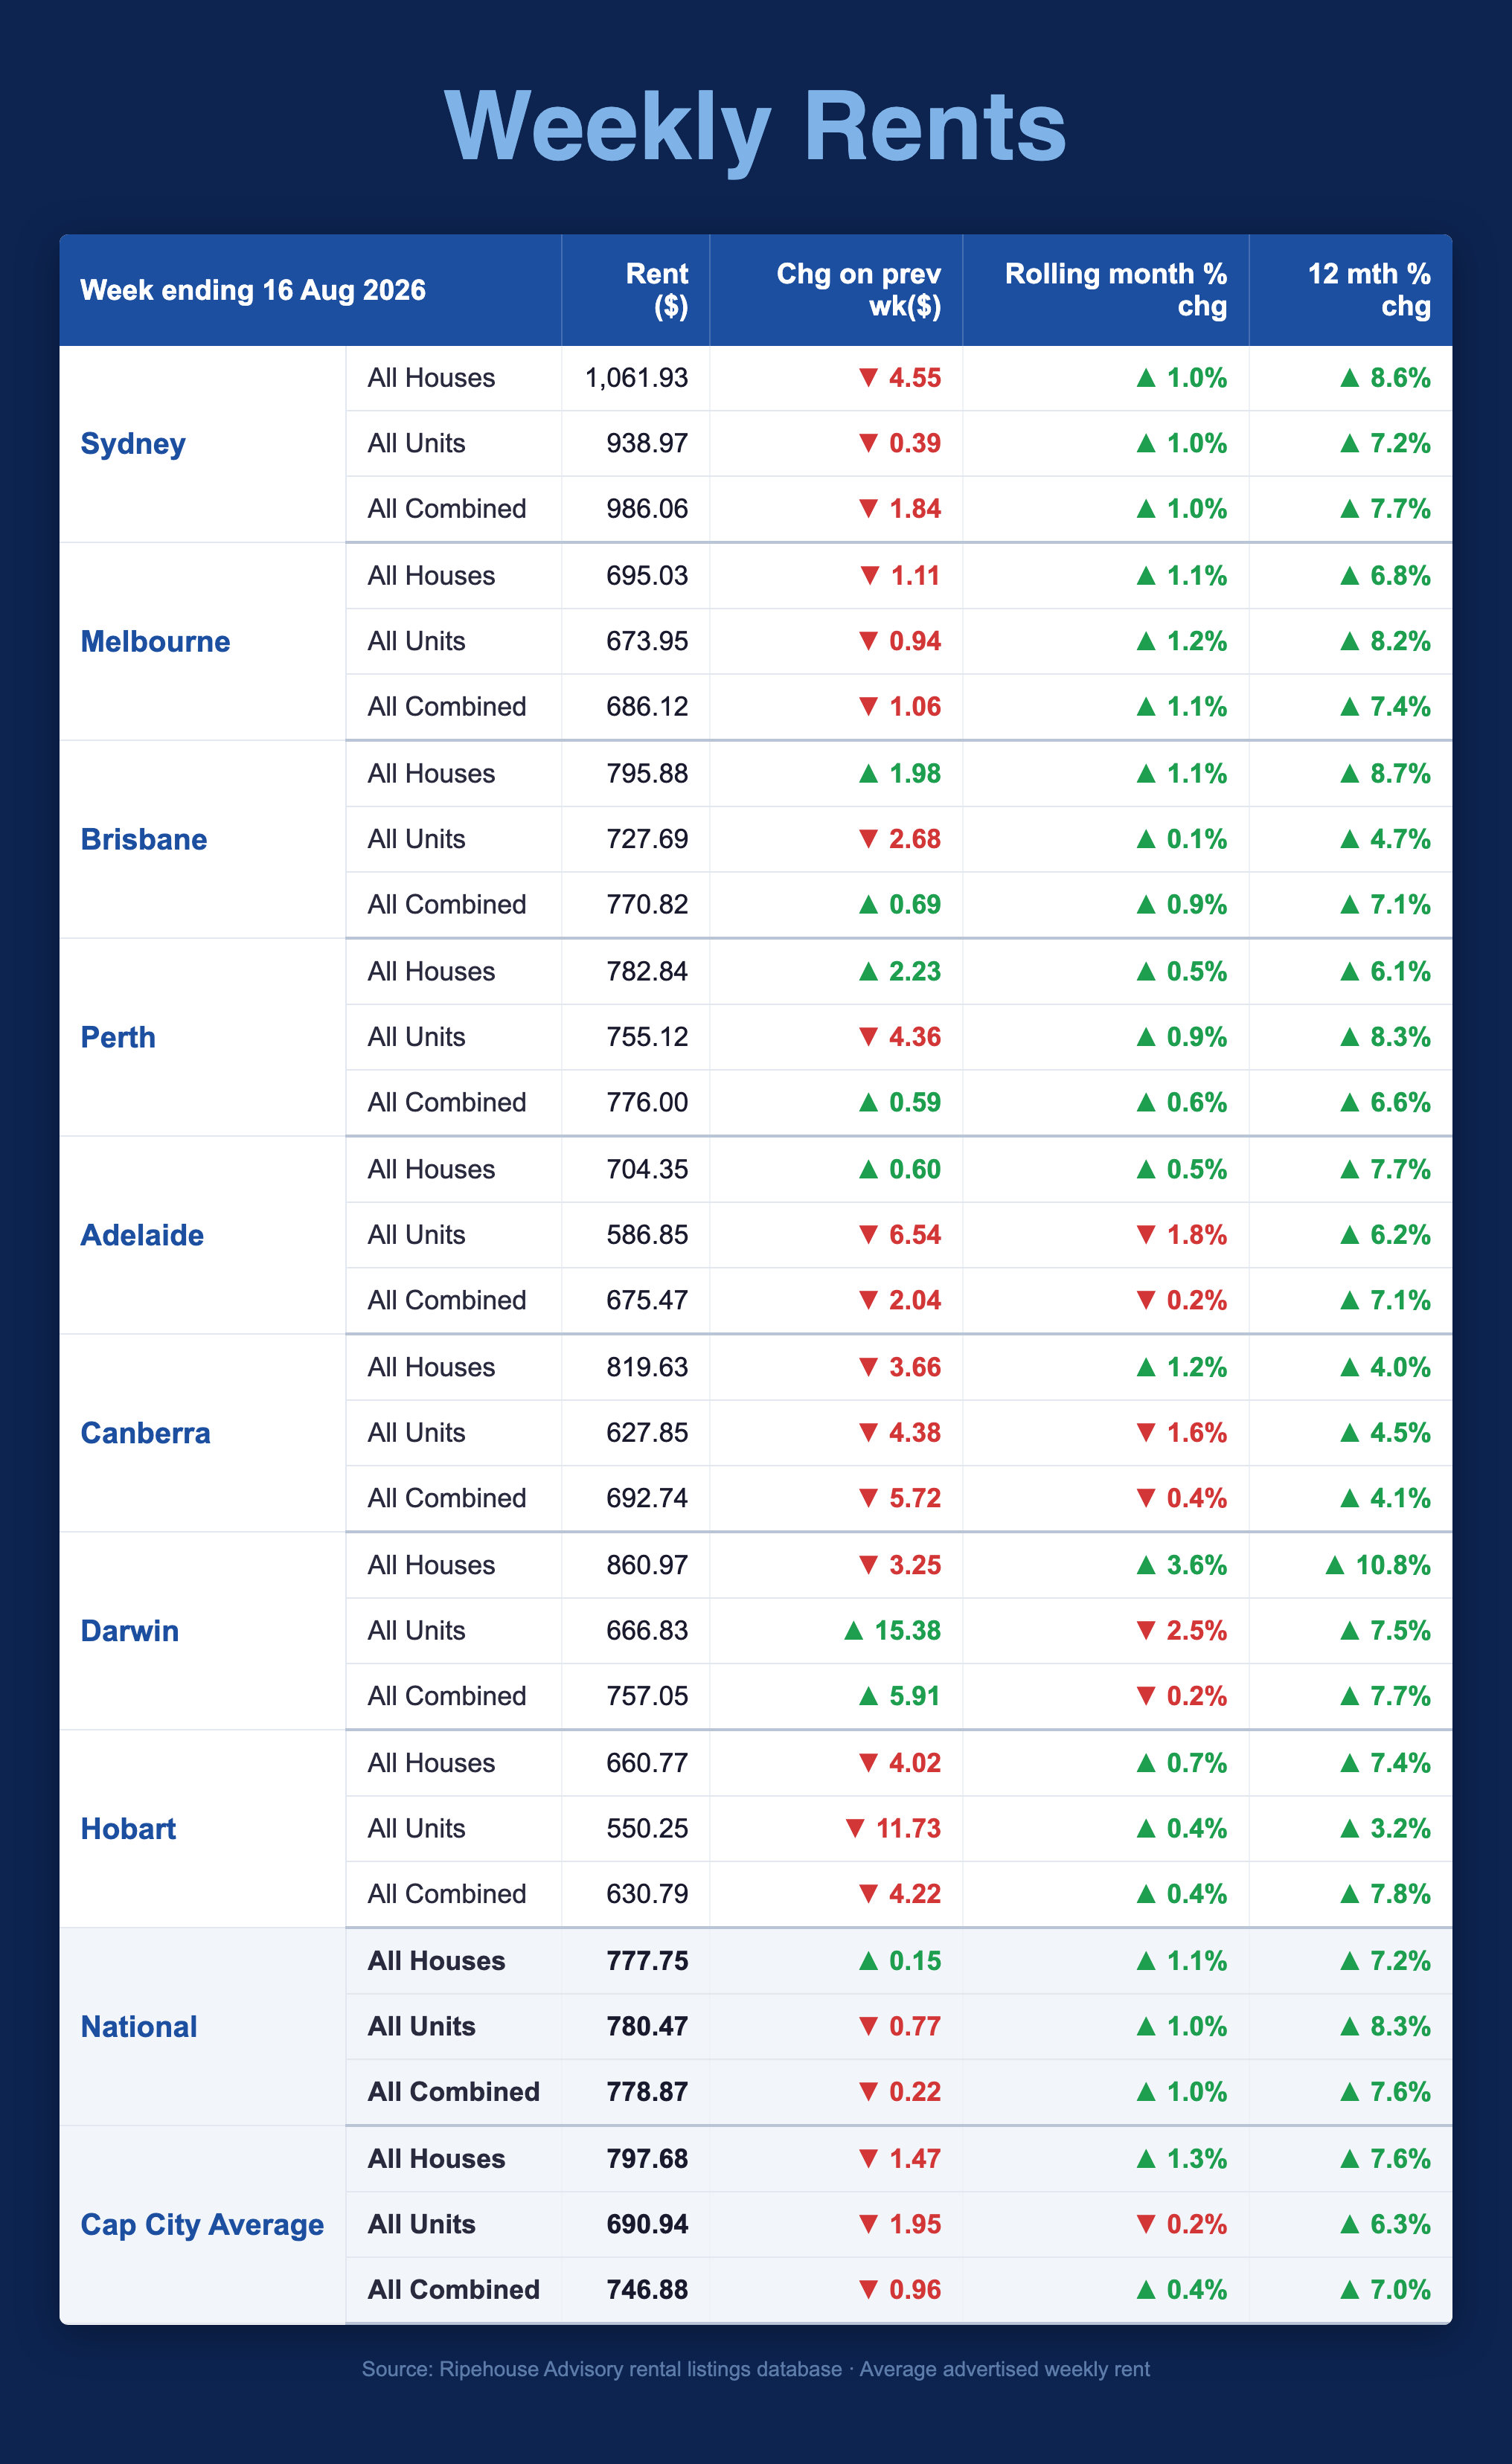
Weekly Rents — Week Ending 16 August 2026
The national combined median asking rent was $778.87 per week in the seven days to 16 August, down $0.22 on the prior week and 7.6% higher than the same week last year, according to the Ripehouse Advisory rental listings database. The national rolling month sits at +1.0%, so the broader trend remains upward even as individual weeks pause. National houses are at $777.75 (up 7.2% annually) and units at $780.47 (up 8.3%) — units remain ahead of houses nationally for the second consecutive week.
Houses and units diverge in Brisbane and Perth
The most interesting pattern this week is the split between dwelling types within the same city. Brisbane houses rose $1.98 to $795.88, taking annual growth to 8.7% — the strongest of any mainland capital house market. Brisbane units moved the other way, down $2.68 to $727.69, with annual unit growth of 4.7% now the softest on the mainland alongside the rolling month at just +0.1%.
Perth shows the same divergence. Houses added $2.23 to $782.84 (up 6.1% on the year), while units fell $4.36 to $755.12. Even after that fall, Perth units are 8.3% higher than a year ago — the strongest annual unit growth of any mainland capital — so the weekly dip reads as consolidation after a strong run rather than a change in trend.
Sydney consolidates below last week's peak
Sydney houses eased $4.55 to $1,061.93 per week after the prior week's $4.46 rise, and units slipped $0.39 to $938.97. The combined Sydney median of $986.06 remains 7.7% above a year ago, with houses up 8.6% annually — the equal-strongest annual house growth in the dataset alongside Brisbane. The rolling month for both Sydney segments is +1.0%, so the underlying pace is intact.
Melbourne steady, Adelaide units pull back
Melbourne houses eased $1.11 to $695.03 and units $0.94 to $673.95, with the combined median at $686.12. Annual growth of 7.4% combined remains solid, and Melbourne is still the most affordable mainland capital for houses — now $100.85 per week below Brisbane houses, a gap that keeps widening. Adelaide units were the week's softest mainland segment, down $6.54 to $586.85 with the rolling month at -1.8%, though Adelaide houses firmed $0.60 to $704.35 and remain 7.7% up on the year.
Canberra soft, small capitals volatile
Canberra recorded the weakest combined reading of the week, down $5.72 to $692.74, with annual growth of 4.1% — the softest of any capital, consistent with the cooler conditions we have tracked there through 2026. Darwin units jumped $15.38 to $666.83 while Darwin houses fell $3.25 to $860.97; at 10.8% annual growth, Darwin houses still hold the strongest twelve-month gain of any capital city segment. Hobart units gave back $11.73 to $550.25 after last week's $15.67 rise — a reminder that small listing counts (266 houses, 99 units in Hobart; 145 and 167 in Darwin) make these the most volatile series we publish.
What this means
Weekly moves were mixed, but the annual picture is uniform: combined rents in every capital are between 4.1% and 7.8% higher than a year ago, and the national rolling month of +1.0% says momentum is holding. For investors, the structural story hasn't changed — houses in Brisbane and Sydney are compounding at close to 9% annually, Perth units remain the standout unit market at 8.3%, and even the softest capital (Canberra at 4.1%) is growing rents well ahead of long-run averages. For tenants, affordability pressure remains most acute in Sydney, where the combined median of $986.06 keeps the $1,000 mark in sight.
Data drawn from the Ripehouse Advisory rental listings database, covering 43,247 house and 30,154 unit listings nationally in the week ending 16 August 2026.
The full data — week ending 16 August 2026
| City | Dwelling | Avg Weekly Rent | Chg on Prev Wk | Rolling Mth | Chg 12 Mth |
|---|---|---|---|---|---|
| Sydney | All Houses | $1061.93 | -$4.55 | +1.0% | +8.6% |
| Sydney | All Units | $938.97 | -$0.39 | +1.0% | +7.2% |
| Sydney | All Combined | $986.06 | -$1.84 | +1.0% | +7.7% |
| Melbourne | All Houses | $695.03 | -$1.11 | +1.1% | +6.8% |
| Melbourne | All Units | $673.95 | -$0.94 | +1.2% | +8.2% |
| Melbourne | All Combined | $686.12 | -$1.06 | +1.1% | +7.4% |
| Brisbane | All Houses | $795.88 | +$1.98 | +1.1% | +8.7% |
| Brisbane | All Units | $727.69 | -$2.68 | +0.1% | +4.7% |
| Brisbane | All Combined | $770.82 | +$0.69 | +0.9% | +7.1% |
| Perth | All Houses | $782.84 | +$2.23 | +0.5% | +6.1% |
| Perth | All Units | $755.12 | -$4.36 | +0.9% | +8.3% |
| Perth | All Combined | $776.00 | +$0.59 | +0.6% | +6.6% |
| Adelaide | All Houses | $704.35 | +$0.60 | +0.5% | +7.7% |
| Adelaide | All Units | $586.85 | -$6.54 | -1.8% | +6.2% |
| Adelaide | All Combined | $675.47 | -$2.04 | -0.2% | +7.1% |
| Canberra | All Houses | $819.63 | -$3.66 | +1.2% | +4.0% |
| Canberra | All Units | $627.85 | -$4.38 | -1.6% | +4.5% |
| Canberra | All Combined | $692.74 | -$5.72 | -0.4% | +4.1% |
| Darwin | All Houses | $860.97 | -$3.25 | +3.6% | +10.8% |
| Darwin | All Units | $666.83 | +$15.38 | -2.5% | +7.5% |
| Darwin | All Combined | $757.05 | +$5.91 | -0.2% | +7.7% |
| Hobart | All Houses | $660.77 | -$4.02 | +0.7% | +7.4% |
| Hobart | All Units | $550.25 | -$11.73 | +0.4% | +3.2% |
| Hobart | All Combined | $630.79 | -$4.22 | +0.4% | +7.8% |
| National | All Houses | $777.75 | +$0.15 | +1.1% | +7.2% |
| National | All Units | $780.47 | -$0.77 | +1.0% | +8.3% |
| National | All Combined | $778.87 | -$0.22 | +1.0% | +7.6% |
| Cap City Average | All Houses | $797.68 | -$1.47 | +1.3% | +7.6% |
| Cap City Average | All Units | $690.94 | -$1.95 | -0.2% | +6.3% |
| Cap City Average | All Combined | $746.88 | -$0.96 | +0.4% | +7.0% |
Average advertised weekly rent across all listings available during the week, Ripehouse Advisory rental listings database. Week runs Monday to Sunday; capital cities defined by GCCSA boundaries.
If there's a specific street you're weighing up right now, check its Street Score first — it's free, takes ten seconds, and tells you whether that street is pulling the suburb average up or riding on it.
Market data & R-Scores for locations in this article
Drill Down Into the Markets Mentioned Above
Inspect live monthly R-Scores, median prices, rental yields, and street-by-street scores for the cities and council areas referenced in this article:
Frequently asked questions
What happened to weekly rents across Australia in the week ending 16 August 2026?
National advertised weekly rents were broadly steady week to week, with the combined median at $778.87 and the national house and unit averages at $777.75 and $780.47 respectively. The broader trend remained upward, with national combined rents 7.6% higher than a year ago and the rolling month at +1.0%.
Which capital city has the highest weekly rent, and is Sydney close to the $1,000 mark?
Sydney has the highest combined capital-city rent at $986.06 per week, and its houses average $1,061.93. The article notes that Sydney keeps the $1,000 mark in sight, making affordability pressure most acute there.
Which cities showed the biggest difference between houses and units this week?
Brisbane and Perth showed the clearest split between dwelling types. Brisbane houses rose while Brisbane units fell, and Perth houses also rose while Perth units dipped, even though Perth units are still 8.3% higher than a year ago.
Where are rents growing fastest on an annual basis?
Darwin houses recorded the strongest twelve-month gain of any capital city segment at 10.8%. Among mainland capitals, Brisbane houses were the strongest house market at 8.7% annual growth, while Perth units led unit growth on the mainland at 8.3%.
What does the article say about the practical outlook for renters and investors?
The annual picture remains positive across every capital, with rents between 4.1% and 7.8% higher than a year ago and the national rolling month still rising. For investors, the main story is ongoing rental growth in cities like Brisbane, Sydney and Perth; for tenants, Sydney remains the tightest and most expensive market.
General information only. It does not take your objectives, financial situation or needs into account, and nothing here is legal, financial, taxation or investment advice specific to your circumstances.