News · 6 August 2026 · 4 min read
Weekly Rents: National Up, Capitals Split — Week Ending 2 August 2026
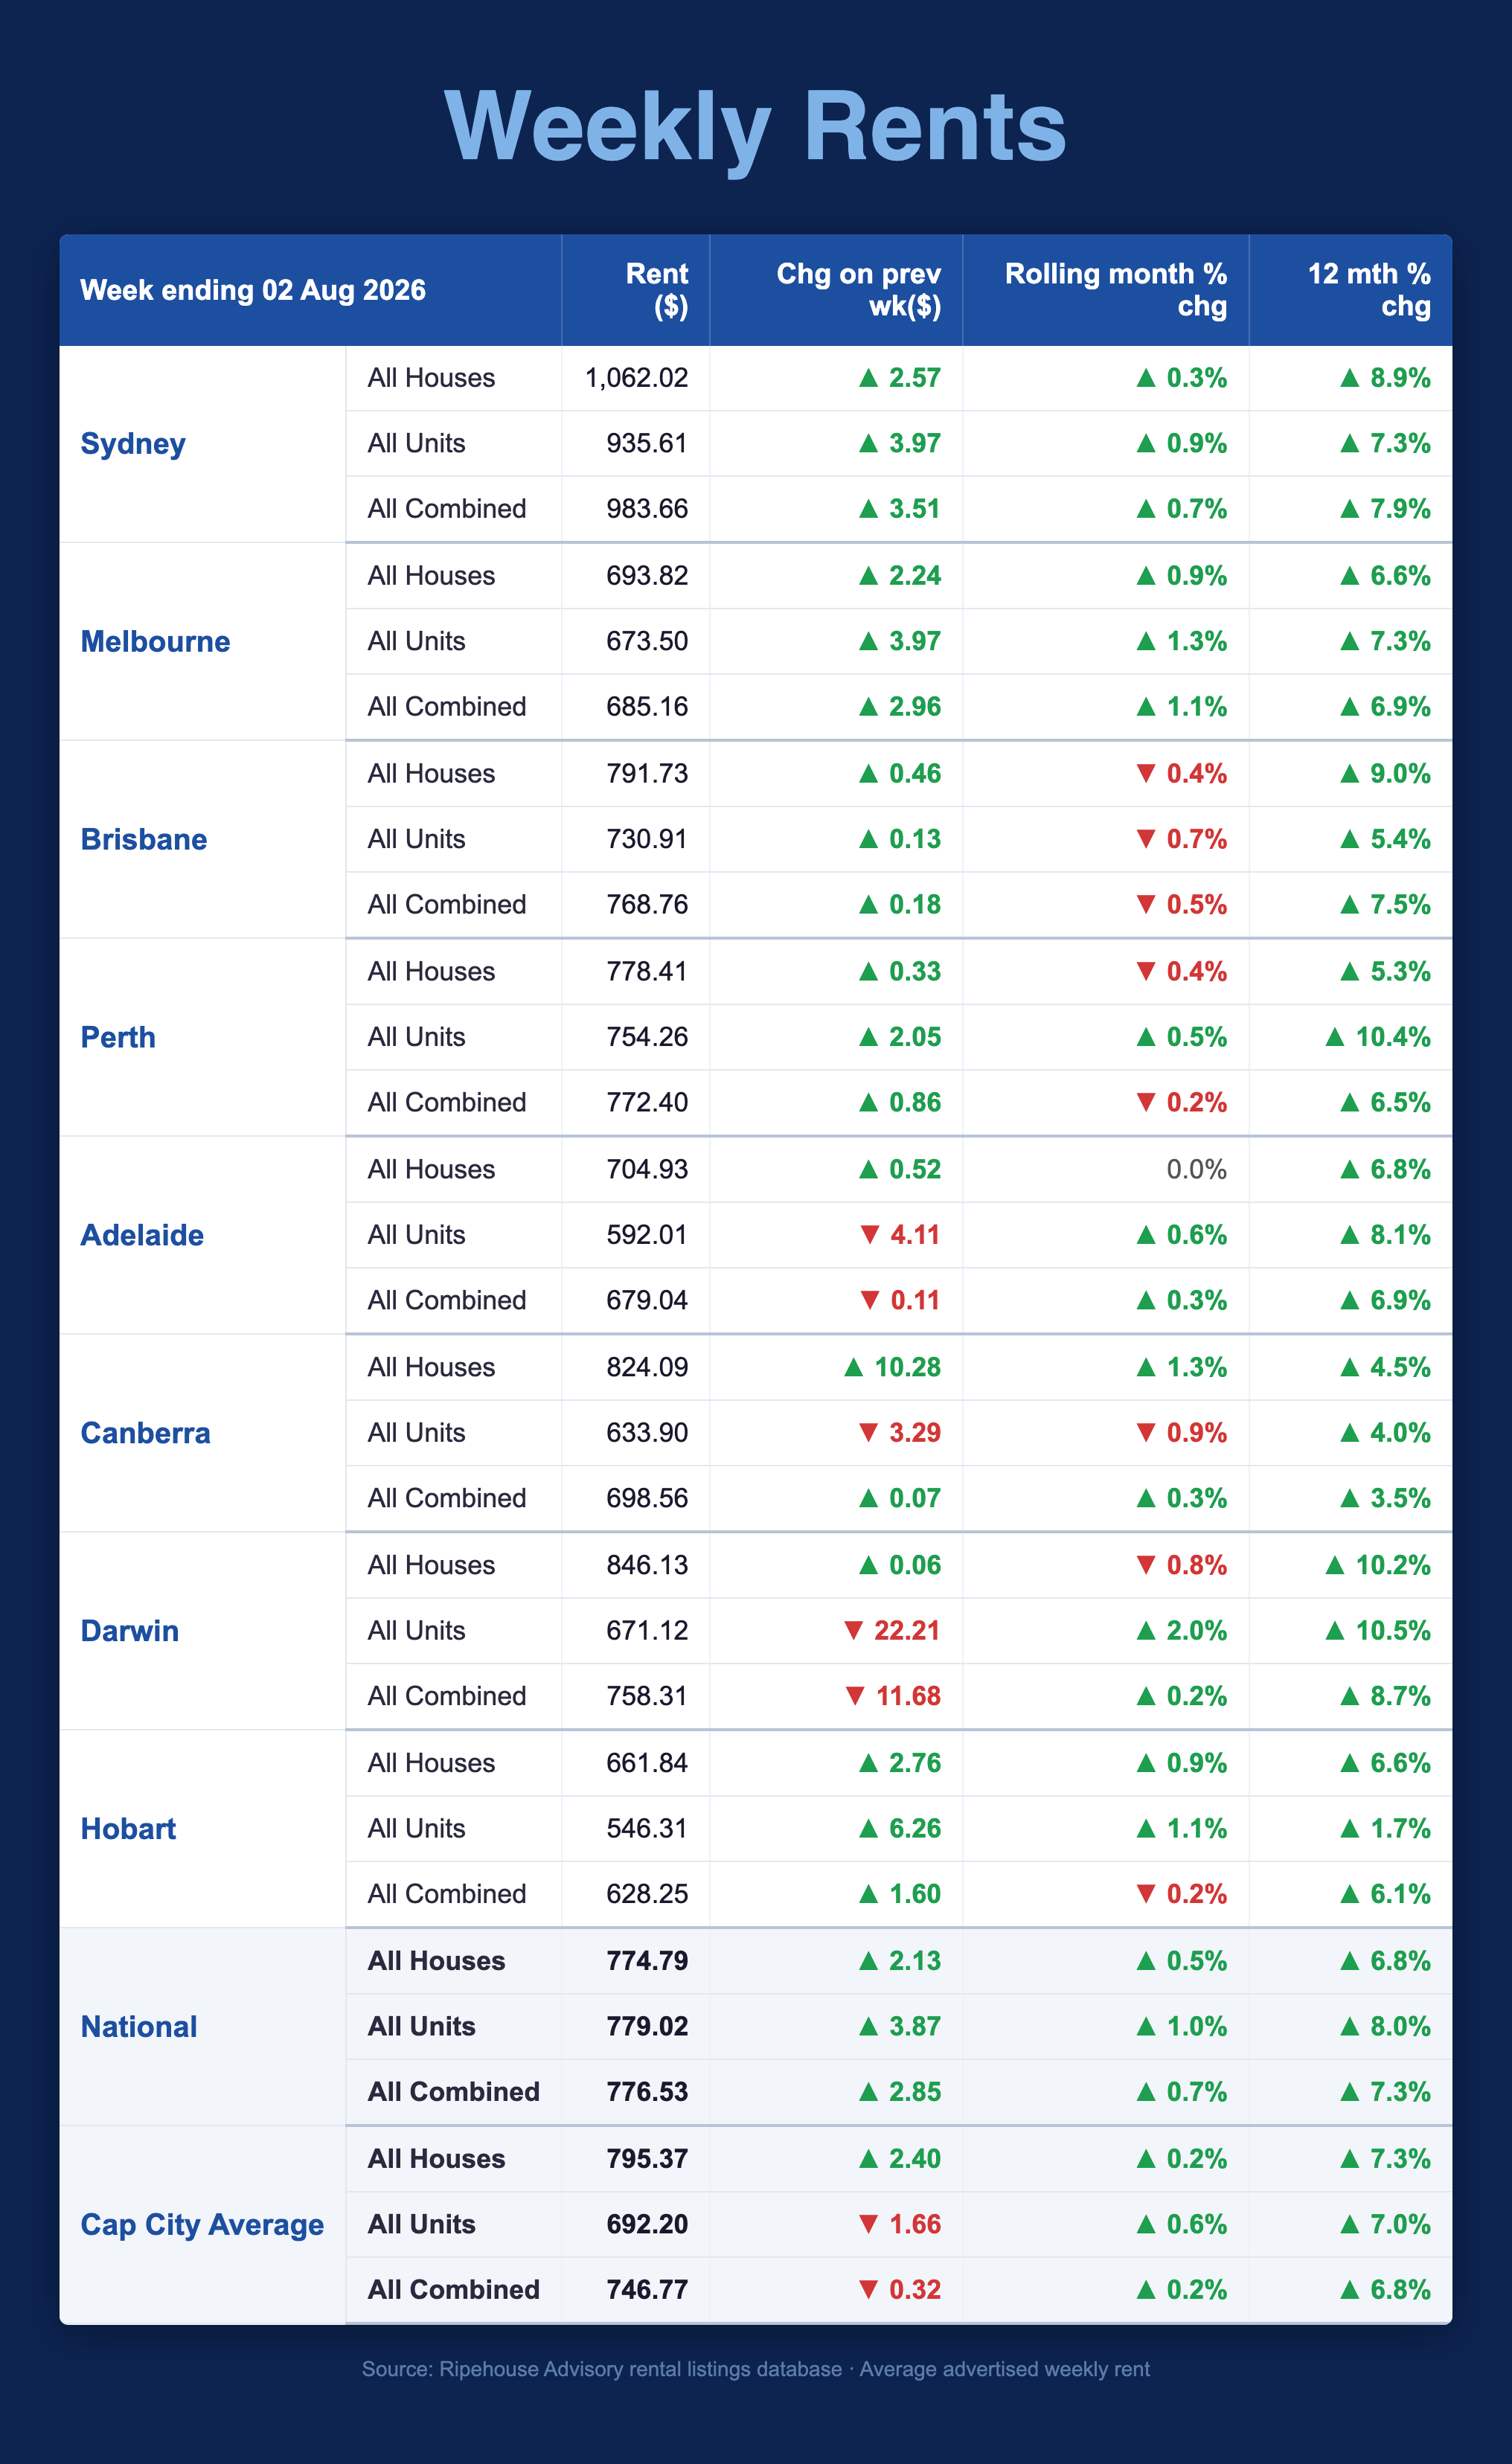
National advertised weekly rents rose $2.85 to $776.53 in the week ending 2 August 2026 — up 7.3% on a year ago — while the Cap City Average slipped $0.32. Sydney houses now average $1,062.02, Darwin is the only capital with double-digit annual growth in both segments, and Melbourne units have converged to within $20 of houses. Full data inside.
(~600 words)
The national rental market continues to tighten, but the headline number now conceals more than it reveals. National advertised rents rose $2.85 this week to $776.53 — up 7.3% on the same week last year — while the Cap City Average actually slipped $0.32 to $746.77. That gap between the national figure and the capital-city average is widening, and it tells you where the pressure is building: outside the averages, in specific segments and specific cities.
Sydney: a two-speed market at the top
Sydney remains in a league of its own. Houses now average $1,062.02 per week — up $2.57 on the week and 8.9% over twelve months — while units sit at $935.61, up $3.97 on the week and 7.3% on the year. Both segments are still rising, but the $126 gap between houses and units is the widest of any capital. For investors, the unit segment is where yield arithmetic still works in Sydney; the house segment is now a pure scarcity play.
Melbourne: the quiet convergence
Melbourne is the quiet achiever this week. Units rose $3.97 to $673.50 — up 7.3% year-on-year — while houses added $2.24 to reach $693.82, up 6.6%. The gap between Melbourne houses and units is now just $20 a week, the narrowest of any capital. Twelve months ago that spread was materially wider. When units converge on houses like this, it usually signals sustained tenant demand being priced out of the house segment first — a pattern that historically precedes broader unit-rent acceleration.
Canberra: same city, opposite directions
Canberra produced the largest single-week move of any capital: houses jumped $10.28 to $824.09. In the same week, Canberra units fell $3.29 to $633.90. One city, two markets moving in opposite directions. Houses are up 4.5% on the year; units are up 4.0%. Weekly volatility is normal in smaller markets, but a $10-plus weekly move in houses is worth watching — if it holds next week, it marks a genuine step-change rather than noise.
Darwin: the twelve-month standout
Darwin remains the strongest annual growth market in the country — the only capital with double-digit growth in both segments. Houses are up 10.2% and units up 10.5% year-on-year. This week, however, illustrates why single-week Darwin numbers need care: units fell $22.21 to $671.12 while houses were flat at $846.13 (up $0.06). With only 137 house and 138 unit listings in the sample, a handful of new listings can swing the average. The twelve-month trend is the signal; the weekly move is mostly noise.
Perth and Adelaide: the rotation continues
Perth units are up 10.4% on a year ago — the second-strongest annual figure in the country — even as Perth houses have cooled to 5.3% annual growth. Adelaide shows the same rotation in miniature: houses steady at $704.93 (up 6.8% on the year), while units fell $4.11 this week but remain up 8.1% annually. The rental shortage hasn't resolved; it has rotated from houses to units and from the big two capitals to the mid-sized markets.
Brisbane and Hobart
Brisbane was flat this week — combined rents up just $0.18 to $768.76 — but remains up 7.5% on the year, with houses at $791.73 (up 9.0% annually). Hobart units jumped $6.26 to $546.31, though the annual figure (up 1.7%) confirms Hobart remains the softest twelve-month market in the country.
What this means
The national number says rents are still rising at more than 7% a year. The city-level data says the growth is concentrating — in Sydney houses, in Melbourne and Perth units, and in Darwin across the board. For investors, the opportunity set is no longer "property" as an asset class; it is specific dwelling types in specific cities. The data is telling you exactly which ones.
The full data — week ending 2 August 2026
| City | Dwelling | Avg Weekly Rent | Chg on Prev Wk | Rolling Mth | Chg 12 Mth |
|---|---|---|---|---|---|
| Sydney | All Houses | $1062.02 | +$2.57 | +0.3% | +8.9% |
| Sydney | All Units | $935.61 | +$3.97 | +0.9% | +7.3% |
| Sydney | All Combined | $983.66 | +$3.51 | +0.7% | +7.9% |
| Melbourne | All Houses | $693.82 | +$2.24 | +0.9% | +6.6% |
| Melbourne | All Units | $673.50 | +$3.97 | +1.3% | +7.3% |
| Melbourne | All Combined | $685.16 | +$2.96 | +1.1% | +6.9% |
| Brisbane | All Houses | $791.73 | +$0.46 | -0.4% | +9.0% |
| Brisbane | All Units | $730.91 | +$0.13 | -0.7% | +5.4% |
| Brisbane | All Combined | $768.76 | +$0.18 | -0.5% | +7.5% |
| Perth | All Houses | $778.41 | +$0.33 | -0.4% | +5.3% |
| Perth | All Units | $754.26 | +$2.05 | +0.5% | +10.4% |
| Perth | All Combined | $772.40 | +$0.86 | -0.2% | +6.5% |
| Adelaide | All Houses | $704.93 | +$0.52 | 0.0% | +6.8% |
| Adelaide | All Units | $592.01 | -$4.11 | +0.6% | +8.1% |
| Adelaide | All Combined | $679.04 | -$0.11 | +0.3% | +6.9% |
| Canberra | All Houses | $824.09 | +$10.28 | +1.3% | +4.5% |
| Canberra | All Units | $633.90 | -$3.29 | -0.9% | +4.0% |
| Canberra | All Combined | $698.56 | +$0.07 | +0.3% | +3.5% |
| Darwin | All Houses | $846.13 | +$0.06 | -0.8% | +10.2% |
| Darwin | All Units | $671.12 | -$22.21 | +2.0% | +10.5% |
| Darwin | All Combined | $758.31 | -$11.68 | +0.2% | +8.7% |
| Hobart | All Houses | $661.84 | +$2.76 | +0.9% | +6.6% |
| Hobart | All Units | $546.31 | +$6.26 | +1.1% | +1.7% |
| Hobart | All Combined | $628.25 | +$1.60 | -0.2% | +6.1% |
| National | All Houses | $774.79 | +$2.13 | +0.5% | +6.8% |
| National | All Units | $779.02 | +$3.87 | +1.0% | +8.0% |
| National | All Combined | $776.53 | +$2.85 | +0.7% | +7.3% |
| Cap City Average | All Houses | $795.37 | +$2.40 | +0.2% | +7.3% |
| Cap City Average | All Units | $692.20 | -$1.66 | +0.6% | +7.0% |
| Cap City Average | All Combined | $746.77 | -$0.32 | +0.2% | +6.8% |
Average advertised weekly rent across all listings available during the week, Ripehouse Advisory rental listings database. Week runs Monday to Sunday; capital cities defined by GCCSA boundaries.
If there's a specific street you're weighing up right now, check its Street Score first — it's free, takes ten seconds, and tells you whether that street is pulling the suburb average up or riding on it.
Market data & R-Scores for locations in this article
Drill Down Into the Markets Mentioned Above
Inspect live monthly R-Scores, median prices, rental yields, and street-by-street scores for the cities and council areas referenced in this article:
Frequently asked questions
Why did national advertised rents rise while the capital city average fell in the week ending 2 August 2026?
National advertised weekly rents rose to $776.53, but the Cap City Average slipped to $746.77. The article says the gap is widening because rent pressure is building outside the broad averages, in specific cities and dwelling types.
Which Sydney rental segment is the tightest, and what does that mean for renters and investors?
Sydney houses are now averaging $1,062.02 a week, while units average $935.61, leaving a $126 gap. The article says the house segment is now a scarcity play, while units are where yield arithmetic still works.
Why is Melbourne's shrinking gap between house and unit rents important?
Melbourne houses average $693.82 and units $673.50, so the gap is just $20 a week. The article says this usually signals tenant demand being priced out of houses first, which can precede broader unit-rent acceleration.
Which capital city had the biggest weekly move in rents, and was it a broad trend?
Canberra houses had the biggest weekly move, rising $10.28 to $824.09, while Canberra units fell $3.29 to $633.90. The article describes this as opposite movement within the same city, so it is not a broad across-the-board trend.
What is the main risk when reading Darwin's weekly rent numbers?
Darwin has the strongest annual growth in the country, with both houses and units up more than 10% over 12 months. But the article warns that small listing samples can swing the weekly figures, so the annual trend is the more reliable signal.
General information only. It does not take your objectives, financial situation or needs into account, and nothing here is legal, financial, taxation or investment advice specific to your circumstances.