News · 8 August 2026 · 8 min read
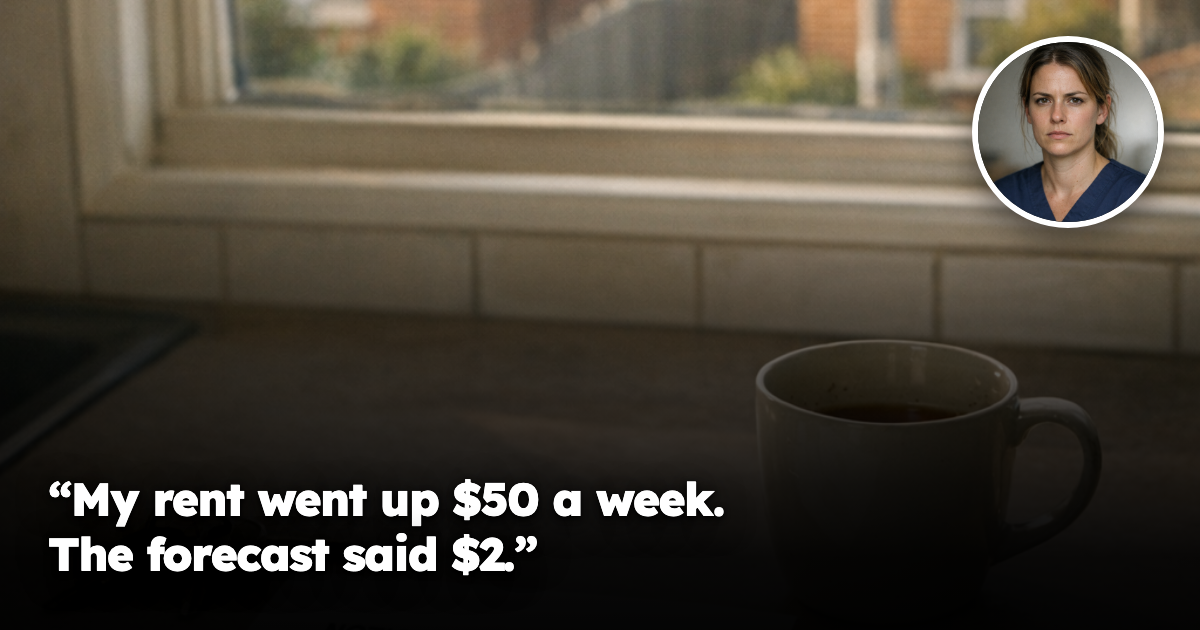
My rent just went up $50 a week. The official forecast said it would go up $2
Her rent went up $50 a week in one quarter. The official forecast said about $2. Both numbers are defensible — and neither of them is about her house. Here is what actually happened to rents in the June quarter, why the market has split into two speeds, and why the gap between a national average and a single address is the entire story.
She read the number three times before she believed it.
She is 31, works in allied health, and has rented the same three-bedroom house in an outer-middle-ring suburb for four years. Good tenant, in the way that phrase is usually meant — never late, never a complaint, mowed the lawn the owner never asked her to mow. She had watched the coverage earlier in the year, the arguments about tax settings and investors and what any of it would do to rents, and she had come away with one figure lodged in her head, because it was the figure everyone repeated: rents would go up by about two dollars a week.
In July her agent emailed a notice. The rent on her house was going up fifty dollars a week. Two thousand six hundred dollars a year, on a household that had already absorbed four years of increases.
Her question, which arrived in our inbox almost exactly as written, was this: "Was the forecast wrong, or was I lied to? And either way — what am I supposed to do now?"
It is a fair question, asked with justified anger, and the honest answer is more interesting than either of the two options she offered.
Both numbers can be accurate. They are measuring different things
This is the part that gets lost in the shouting, and it matters, because the confusion is what leaves people unable to make a decision.
A published forecast of the kind she remembered is a national, forward-looking, average projection of the effect of one variable, usually expressed per week, usually over a multi-year horizon, and usually holding everything else constant. It is an estimate of one input's contribution to a very large aggregate.
What landed on her doormat is an actual, single, present-tense price, set by one owner, on one house, in one street, in one market, in one quarter — and it reflects everything at once: local vacancy, what the last three comparable houses achieved, what the owner's own costs have done, and how many people turned up to the last inspection.
Those two numbers were never going to match. They were never the same kind of number. A national average projection of one factor's contribution can be perfectly defensible at the same time as an individual tenant's rent moves twenty-five times that much, for reasons that have nothing to do with the factor being projected.
Which is not a defence of anybody. It is the setup for the actually useful point, which is that neither number tells her anything about her house — and that the one number that would have told her something was available to her, and to the owner, and to any prospective buyer, the entire time.
What actually happened to rents in the June quarter
The measured national picture is sharper and stranger than the headlines suggest.
Across the combined capitals, house rents rose $20 in the June quarter — the strongest annual growth in almost two years. Unit rents rose $5. The move was described in the data as stronger than seasonal norms and abrupt in some cities: a step-change in pricing behaviour, not a gradual tightening.
The timing is the interesting part. As clarity emerged during April and May around proposed changes to the tax treatment of housing investment, owners appear to have moved quickly to lift asking rents wherever conditions allowed — bringing increases forward rather than letting them feed through slowly. Higher borrowing costs on the back of recent rate moves pushed the same way, with owners under more pressure to offset holding costs. So far this shows up in pricing behaviour rather than in a collapse in availability. The structural effects, if they come, come later.
Underneath that national average, the spread is enormous:
- Sydney house rents jumped 6.3% — $50 a week — to a record $850. The strongest quarterly rise in four years, and roughly five times faster than the same quarter a year earlier.
- Darwin house rents rose 5.6% to $760, with unit rents up 8.3% — the biggest quarterly unit move since 2009 — against a record-low 0.1% vacancy rate.
- Brisbane houses rose 2.9% to a record $700, a fourth consecutive quarterly rise, with vacancy at 0.6%.
- Melbourne house rents rose 0.8% — five dollars — to $600, with annual growth of just 1.7%. Melbourne unit rents did not move at all.
- Perth house rents rose 0.4%. Three dollars. The weakest June quarter there in six years.
- Adelaide, Canberra and Brisbane unit rents were all completely flat, with Brisbane ending a run of six consecutive quarters of growth.
Read that list again with her question in mind. In the same three months, in the same country, under the same tax debate and the same interest rates, one tenant's house went up fifty dollars a week and another tenant's unit went up nothing at all.
The forecast said $2. The reality was somewhere between $0 and $50, depending entirely on where you happened to live. That is not a forecasting failure. That is dispersion — and dispersion is the single most under-appreciated fact in Australian property.
The market has split into two speeds
The most consequential finding in the June data is not the size of the increases. It is that the rental market has stopped moving as one thing.
Vacancy rates remain extraordinarily tight almost everywhere — 0.1% in Darwin, 0.4% in Adelaide and Hobart, 0.5% in Perth, 0.6% in Brisbane, and 1.1–1.2% in Sydney, Melbourne and Canberra, against a balanced market conventionally reckoned at around 3%. Nationally the vacancy rate sits near 1.7% and rental listings have fallen across every mainland capital over the past year, while completions run well below the national housing targets.
And yet tight vacancy is no longer producing uniform rent growth. In Sydney, Darwin, Brisbane and Canberra, rents accelerated despite already-tight conditions — owners in those markets still had room to push. In Melbourne, Adelaide, Perth and Hobart, the same tightness produced almost nothing, because affordability has become the binding constraint. Tenants there have simply reached the end of what they can pay, and a landlord cannot charge a rent that nobody can afford, no matter how few vacant properties there are.
That is a genuinely important shift, and it cuts both ways. It is a warning to any investor who has been underwriting purchases on the assumption that a low vacancy rate automatically converts into rent growth — it demonstrably does not, in half the country. It is also the reason the widely-repeated claim that rents will simply keep climbing indefinitely deserves more scepticism than it usually gets. Rents have added more than $200 a week to the national median over five years and now take a record share of tenant household income. There are real question marks over how much further that can run.
Both of those things are true at once. The shortage is real; the ceiling is also real; and which one you meet depends on the address.
The thing neither number could tell her
Here is where we can actually be useful, and it is the point of the whole article.
Her rent moved $50 because of conditions in her street — the achieved rents on the last few comparable houses near her, how long those properties sat empty, how many households were competing at the inspection. Not because of a national forecast. Not because of a capital-city median. Because of a few hundred metres of road.
This is what our research exists to measure, and it is why we argue relentlessly that a suburb is not a unit of analysis. Within a single suburb — one median, one postcode, one council, one train station, one school catchment — we routinely measure a 20–30% spread in effective yield between the strongest and weakest streets, using achieved rents, actual vacancy duration and real days-on-market rather than advertised asking prices. Two houses that a spreadsheet would treat as identical, and that any national number treats as the same data point, behave completely differently, year after year.
It is the same effect we've written about when a $210,000 renovation came back valued at almost nothing because the street set the ceiling, and when an insurer's premium priced one address entirely differently from its neighbours. Different instruments, same finding: the meaningful variation in Australian property lives below the level at which almost everybody measures it.
Which reframes her situation completely. She experienced her rent rise as something done to her by a policy debate. It was actually a straightforward local pricing event, in a street with almost no competing stock, that was entirely visible in the data before it happened — and that was equally visible to anyone considering buying in that street.
What this means for you
She asked what she was supposed to do now, and the answer split into two parts.
If you are renting: the notice you receive is a price signal about your street, not a national statistic. Before you accept, contest or move, find out what comparable properties within a few streets have actually achieved recently, and how long they took to let. Sometimes that tells you the increase is under market and you are still well placed. Sometimes it tells you the increase is opportunistic in a pocket that is softening. You cannot know which without looking at the street, and almost nobody looks.
If you are looking at buying — including buying the thing you currently rent, or your first investment: this quarter is a clean demonstration of why the choice of street matters more than the choice of city. Two investors bought in the same quarter, in capitals with almost identical vacancy rates, and one is collecting $50 a week more while the other is collecting nothing more at all. That gap was not luck and it was not policy. It was location selection at a resolution finer than a suburb, and it is knowable in advance.
The reason we remain firmly positive about well-selected residential property, even in a quarter that produced this much noise, is precisely what her story demonstrates. A structural shortage is genuine: listings are falling, completions are running below target, and demand is projected to outrun supply for years. But the shortage is not paying out evenly, and it never will. It is paying out in specific streets, in specific stock, to owners who chose on evidence rather than on a median — and it is quietly failing to pay in the places where affordability has already hit the wall.
Headlines are national. Forecasts are national. Medians are national. Rent cheques are not. They are written street by street, and so is every outcome that follows from them.
She spent four years reading about the rental market and no time at all reading about her street. Almost everyone does it in that order.
If there's a specific street you're weighing up right now, check its Street Score first — it's free, takes ten seconds, and tells you whether that street is pulling the suburb average up or riding on it.
Market data & R-Scores for locations in this article
Drill Down Into the Markets Mentioned Above
Inspect live monthly R-Scores, median prices, rental yields, and street-by-street scores for the cities and council areas referenced in this article:
Frequently asked questions
Why could my rent go up $50 a week even if the official forecast said rents would only rise about $2?
Because the forecast was a national, forward-looking average, while your rent is a real price set for one house in one street. The article says those numbers measure different things, so a big local increase can happen even when the national forecast is small.
What actually happened to rents in Australia in the June quarter?
Combined capital city house rents rose $20 a week in the June quarter, while unit rents rose $5. But the results varied sharply by city, from Sydney house rents up $50 a week to Melbourne house rents up just $5 and Perth house rents up $3.
Why are rent increases so different from one city to another even when vacancy is tight everywhere?
The article says the rental market has split into two speeds. In some cities, tight vacancy still lets owners push rents higher, while in others affordability is the binding constraint and tenants simply cannot pay more.
What does this mean if I’m a tenant facing a rent increase in Australia?
The notice is a price signal about your street, not a national average. The article says you should check what comparable properties nearby have actually achieved recently and how long they took to let before deciding what to do.
What is the main lesson for someone thinking about buying or investing in property?
The article’s main point is that street-level selection matters more than city-level averages. Two properties in the same capital can produce very different rent outcomes, so location choice at a finer-than-suburb level is what drives results.
General information only. It does not take your objectives, financial situation or needs into account, and nothing here is legal, financial, taxation or investment advice specific to your circumstances.