News · 4 August 2026 · 6 min read
'One big bank says Sydney will fall 10%. Another says Perth will rise 15%. I own two investment properties — do I sell before the crash?'
One major bank has cut its Sydney forecast to −10 per cent for 2026. Another is still forecasting national growth above 5 per cent, with Perth up 15. Same market, same month, a 25-point spread. An investor asked us whether to sell before the crash — and our answer had almost nothing to do with the forecasts.
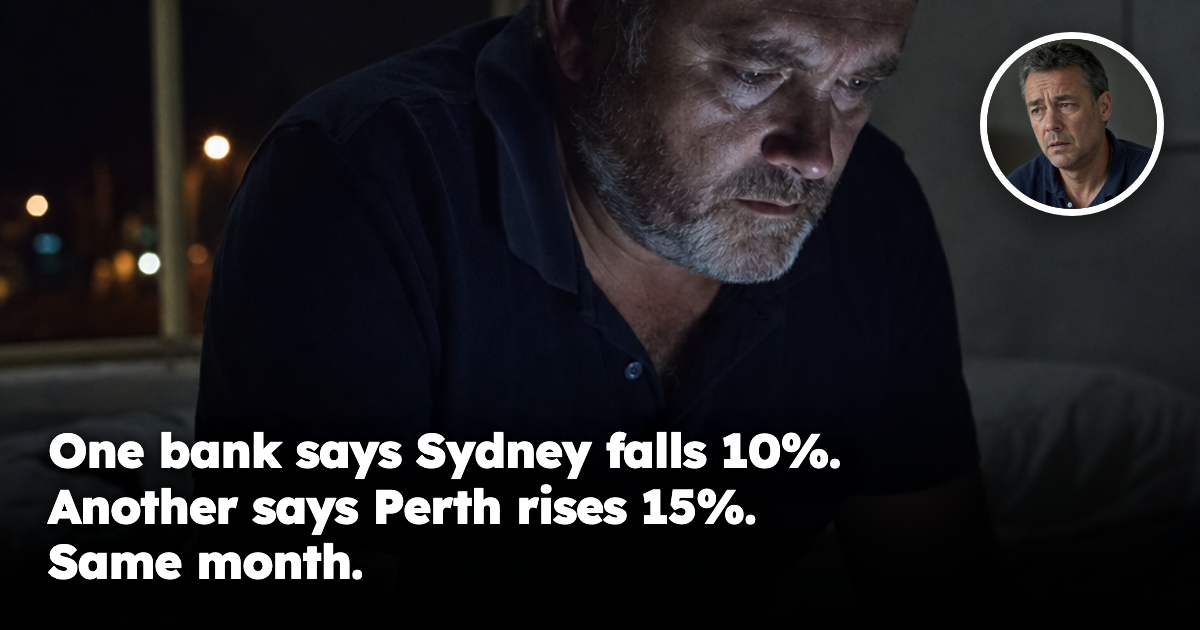
He’d been awake since 3am, scrolling on his phone in the dark, and by the time the question landed with us it had been rewritten four times.
Marcus is 47, works in logistics operations in Sydney’s west, and owns three properties: the family home, a townhouse in Western Sydney, and a house on Brisbane’s southside. He is not wealthy. He is leveraged, and he is tired.
What set him off was a single week of headlines. One major bank had just slashed its forecast and now expects Sydney dwelling values to fall 10 per cent across 2026 — up from a 6 per cent fall it was predicting only a month earlier. Melbourne, on the same forecast, drops 9 per cent. Capital city house prices overall: down 5 per cent, revised from down 2 per cent in July. Brisbane’s growth cut from 9 per cent to 2. Perth cut from 14 per cent to 5. Adelaide from 7 to 1.
Then, in the same month, from another of the big four: national dwelling prices up a bit over 5 per cent this year. Perth up 15 per cent. Brisbane up 12 per cent.
That is a 25-percentage-point disagreement about the same market, published within weeks of each other, by two of the largest mortgage lenders in the country. A third major bank has Melbourne rising 4 per cent this year and 6 per cent next. A major consultancy that was recently forecasting a 7.7 per cent national rise has since moved to a small national fall.
So Marcus asked the obvious question.
The question
“They can’t all be right. One of them is telling me I’m about to lose a hundred grand and another is telling me I’ll make a hundred grand. I can’t sit here and do nothing. Do I sell the Brisbane one before the crash, or don’t I?”
The answer
Here’s the uncomfortable part, and we say it to almost everyone who comes to us in this state: you are trying to make a street-level decision using a country-level number, and it cannot be done.
Not “it’s hard.” It cannot be done. The number does not contain the information you need.
Think about what a national or even a capital-city forecast actually is. It’s an average of an average. It blends a $4 million Mosman house with a one-bedroom apartment in an oversupplied inner-city tower, a house-and-land package on an estate that still has 700 lots to release, and an established three-bedroom home on a tightly held street eight minutes away where nothing has come up for sale in fourteen months. Those four assets will do wildly different things over the next 24 months. Averaging them produces a number that describes none of them.
And you can see this happening inside the current data, not just in theory. The same downturn that is hitting prestige markets hardest has left entry-level and mid-market stock comparatively firm. Individual properties are still selling well above expectations in the middle of a “slowdown”. Those aren’t anomalies. That’s the market doing what it always does — moving at different speeds in different places, while the headline reports the blur. It’s the same effect we broke down when the top end fell 3.2 per cent while the bottom end rose: one number, two completely different markets underneath it.
This is the entire reason our research engine works at street and suburb level rather than city level. When we run our data across two suburbs that sit side by side and score them on supply, demand, days on market, vacancy, rental depth and owner-occupier strength, we routinely find R-Score gaps of 40 to 60 points between neighbours that any forecast — and any newspaper — treats as one market. We have published side-by-side breakdowns where one suburb scores near the top of the country and its neighbour is nowhere close, and the gap between three suburbs that look interchangeable on paper is the single biggest driver of investor outcomes we see.
Go one level finer and it gets starker. Within a single suburb, the spread between the strongest and weakest streets is frequently the difference between a property that holds through a downturn and one that gives back three years of growth. Flood overlay on one side of a road and not the other. A future arterial. A pocket where 80 per cent of homes are owner-occupied backing onto a pocket that’s 70 per cent rentals with a development approval pipeline behind it. Same suburb name. Same “market”. Two completely different investments. We’ve written before about why the real story is in the streets rather than the postcode.
So the honest answer to Marcus’s question is: nobody can tell you whether to sell your Brisbane house from a national forecast, including the banks issuing them. They aren’t trying to. Those forecasts exist to guide loan book provisioning and economic modelling. They were never designed as an instruction to an individual investor about an individual asset, and using them that way is a category error. It’s exactly why a headline Brisbane decline of 1.2 per cent tells you almost nothing about a specific house on a specific southside street.
What we told him to look at instead
Four things, in this order:
- The street and suburb fundamentals of the two assets he actually owns. Not Brisbane. Not “the Brisbane market.” The specific streets. Supply coming, vacancy, days on market, tenant demand depth, who the buyer pool is at resale.
- His actual holding capacity, stress-tested. Three rate rises have already landed this year. What happens at his real serviceability limit, not his comfortable one? An investor forced to sell at the wrong moment is the only investor who reliably loses money.
- Rent, not price. Price is a number he can’t control and doesn’t realise until sale. Rent is cash flow that determines whether he keeps the asset long enough for price to become irrelevant. With rents at records in every capital, that side of the ledger is doing more for his position than any forecast.
- Time horizon. If his horizon is 12 months, he shouldn’t be in property at all. If it’s 10 years, a 2026 forecast — either forecast — is noise.
Note what’s not on that list: what any bank thinks Sydney will do.
What this means for you
If you own property right now, the volume of contradictory expert commentary is going to get louder, not quieter. Forecast revisions of four and five percentage points inside a single month are a signal about forecaster uncertainty, not about your asset.
Two practical takeaways:
Don’t sell a good asset because of a bad headline. The most expensive decisions we see investors make are panic decisions made on aggregate data, at night, alone. Selling costs are real, immediate and certain; the forecast is none of those things.
Do get resolution on what you own. “I own a house in Brisbane” isn’t a position you can assess. “I own a three-bedroom home on a tightly held owner-occupier street with 1.1 per cent vacancy, 19 days on market, no development pipeline within 800 metres and rent up 8 per cent on last renewal” is. One of those you can make a decision about. The other is a feeling.
The bottom line
Here is what the forecast spread actually tells you, and it’s more optimistic than it looks: if the country’s best-resourced economists can’t agree on the direction of the market to within 25 percentage points, then the market is not a single thing that moves as one. It’s thousands of micro-markets moving independently. That is not a reason to get out of property. It is precisely the reason property rewards research — because in a market moving at one speed, everyone gets the same result, and in a market moving at a thousand speeds, the investor with better data at street level gets a materially better outcome than the investor reading averages.
Downturns don’t punish property investors. They punish under-researched, under-buffered positions in the weakest streets — and they hand well-bought assets on strong streets to the people patient enough to be holding them. The headlines will keep contradicting each other. The data underneath them keeps working regardless.
Marcus still owns three properties.
If there's a specific street you're weighing up right now, check its Street Score first — it's free, takes ten seconds, and tells you whether that street is pulling the suburb average up or riding on it.
Market data & R-Scores for locations in this article
Drill Down Into the Markets Mentioned Above
Inspect live monthly R-Scores, median prices, rental yields, and street-by-street scores for the cities and council areas referenced in this article:
Frequently asked questions
Can I decide whether to sell my investment property based on a Sydney or national property forecast?
No. The article says a national or capital-city forecast is too broad to guide a decision about one specific property, because it mixes very different markets and properties together.
Why do bank property forecasts disagree so much with each other?
The article suggests the forecasts reflect uncertainty and are built for broad economic and loan-book modelling, not as instructions for individual investors. That is why one bank can see Sydney falling while another sees national prices rising.
What should I look at instead of headlines if I own property in Brisbane or Sydney?
Focus on the specific street and suburb fundamentals of the asset you own, including supply, vacancy, days on market, tenant demand, and the buyer pool at resale. The article says those local factors matter more than the city-wide forecast.
What is the biggest risk in selling an investment property because of a crash prediction?
The main risk is making a panic decision based on aggregate data rather than your actual asset. The article says selling costs are real and immediate, while the forecast may not describe your property at all.
What should an investor check before deciding whether to hold or sell?
The article says to check holding capacity under stress, the rent and cash flow, and your real time horizon. If your horizon is only 12 months, property may not suit you; if it is 10 years, a 2026 forecast is mostly noise.
General information only. It does not take your objectives, financial situation or needs into account, and nothing here is legal, financial, taxation or investment advice specific to your circumstances.