Market Analysis · 23 July 2026 · 4 min read
Brisbane Property Prices Down 1.2%: Why the Headline Misses the Market
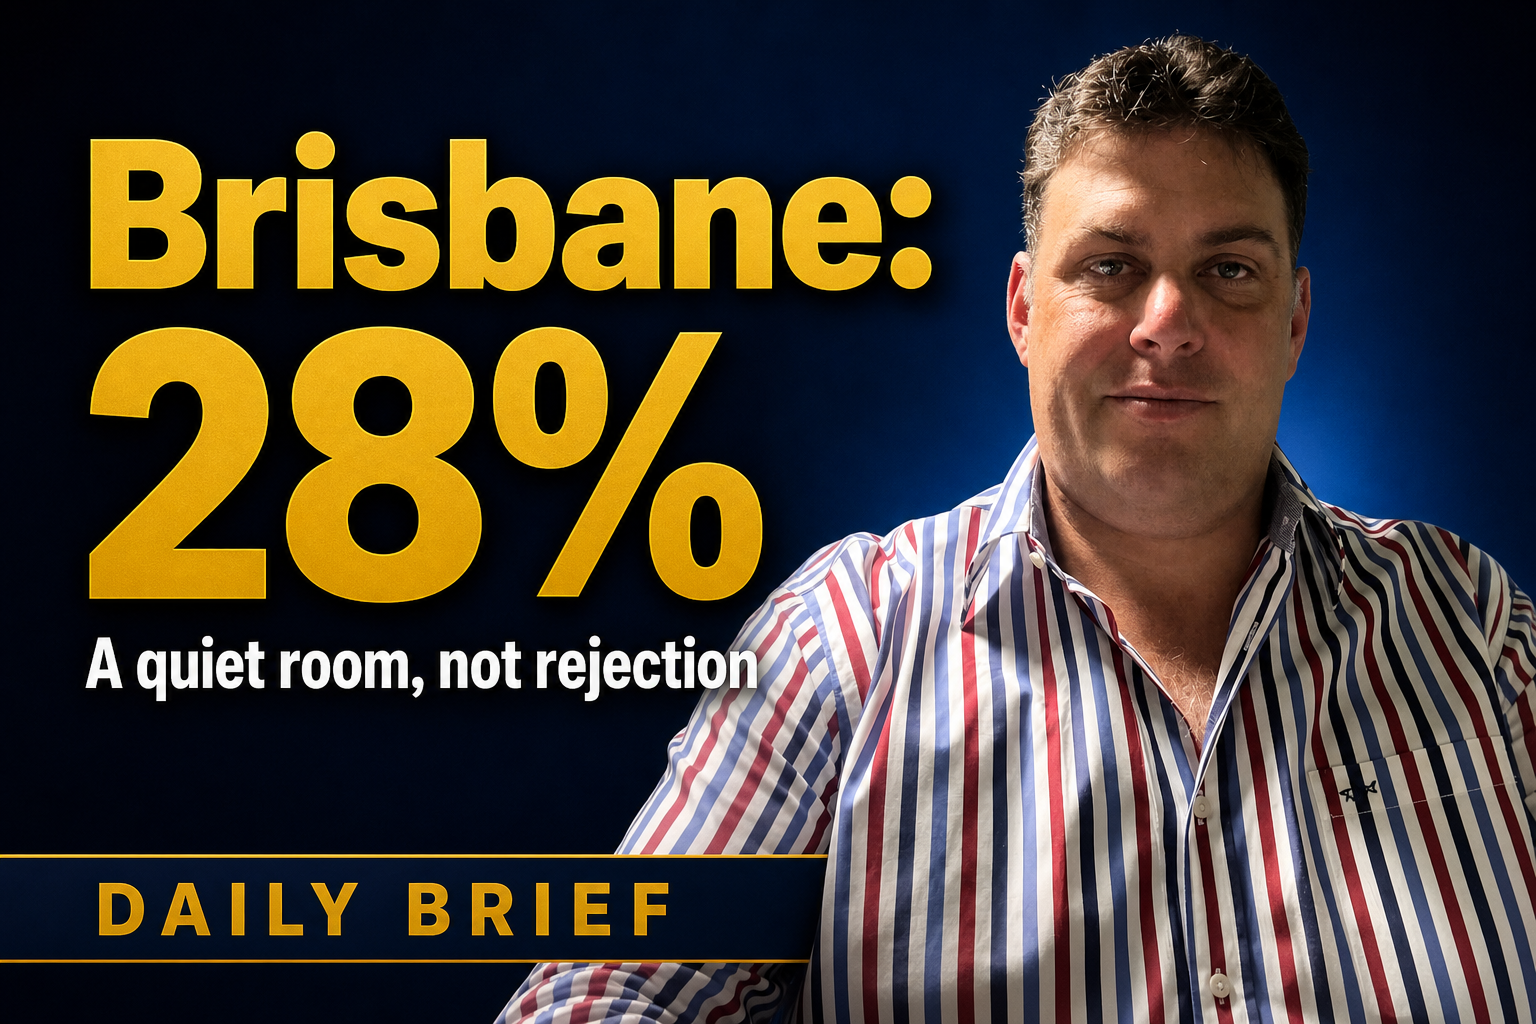
Brisbane property prices are down 1.2% in the latest quarter, but the citywide headline misses tight, low-vacancy suburbs like Windaroo. The real story is in the local data, not the average.
▶ Watch the full video on YouTube: 1.2% Brisbane falls, but the streets tighten
Brisbane’s 1.2% quarterly fall in unit prices has grabbed the headlines, but the real story is more specific than a citywide average suggests. Listings are up 24% year-on-year, yet some pockets inside Greater Brisbane are still tight on supply, low on vacancy and holding value.
That’s the difference between a macro headline and a market you can actually buy into with confidence.
Brisbane property prices: the headline is not the whole market
The recent Brisbane property prices story is being framed as a citywide warning sign. Domain’s chief economist says the brakes are slamming on, and the numbers do look softer at first glance:
- Unit prices down 1.2% in the second quarter
- Listings up 24% year-on-year
- Brisbane unit prices at their first quarterly fall in three years
But a citywide unit median blends very different product types and locations into one average. Inner-city towers, older high body corporate blocks and established houses in constrained suburbs are not the same market.
That matters, because oversupply in one segment does not automatically mean weakness everywhere.
Why a citywide median can hide the real opportunity
When listings surge and a median falls, it often points to pressure in specific parts of the market: investor-heavy stock, weaker absorption, and buildings or precincts where supply has outrun demand.
What it does not tell you is where stock is still scarce.
Our system flagged one suburb inside Greater Brisbane where:
- listing count for the past 12 months was effectively zero
- vacancy sits at 0.6%
- owner-occupier rate is 80.4%
- days on market are just 16
- sold prices are up 3.3% over the quarter
That is not a market collapsing. It is a market where the local data is doing the opposite of the city headline.
Windaroo: a Brisbane suburb with tight supply and low vacancy
Windaroo, Queensland 4207 in Logan City, is a good example of why local data matters.
Ripehouse Advisory’s system gave Windaroo an R-Score at the 100th percentile, with:
- median sold price of $482,500
- gross yield of 4.28%
- vacancy at 0.6%
- population of 2,827
- population growth of 7% over three years
- roughly 25 sales since last September
- days on market of 16
- sold prices up 3.3% over the quarter
This is a stable, lived-in residential suburb, not an investor tower market.
The rental stock is tight, the owner-occupier base is strong, and supply is thin. In other words, the Brisbane headline is not describing this suburb particularly well.
Brisbane property prices by street: why local structure matters
Street-by-street analysis inside Windaroo shows how easily a suburb median can flatten out important differences.
A few clear patterns stand out:
- Premium streets cluster in the elevated established pockets away from motorway noise
- Streets closest to the interchanges carry a discount
- Mid-block streets often show the strongest rental yield story
- Owner-occupier density is highest in the established interior streets
- Public and social housing concentration is present in parts of Logan City and concentrated on specific streets
The result is that two streets in the same suburb can behave like two different rental markets.
That’s exactly why a simple citywide median is not enough if you are trying to buy well.
Genbrook shows the same pattern near Melbourne
The same disconnect appears outside Queensland.
Genbrook, Victoria 3783 in the Dandenong Ranges, about 65 kilometres east of Melbourne, also screened at the 100th percentile in our system.
Its local data includes:
- median sold price of $675,000
- gross yield of 4.43%
- vacancy at 1.1%
- owner-occupier rate of 83.9%
- population of 2,350
- population growth of over 15% in three years
- days on market of 17
- supply at barely 2% of stock
- sold price signal up 10.5%
That is happening while Melbourne has posted the steepest four-year price drop of any capital.
Again, the headline is broad. The local market is the real decision-maker.
What this means for buyers and investors
The question is not whether Brisbane property prices are falling.
The better question is: which Brisbane?
A falling unit median alongside rising listings can signal oversupply in specific segments, especially inner-city units and older buildings with heavy body corporate costs. But it can also create opportunities in supply-constrained residential suburbs where vacancy is low and owner-occupiers dominate.
For buyers and investors, that means:
- don’t buy the headline
- buy the micro-market
- separate oversupplied stock from structurally tight stock
- use vacancy, yield, days on market, owner-occupier rate and sale velocity together
That is where professional research matters.
The Ripehouse Advisory take
Brisbane’s quarterly fall does not mean the city is broken. It means the market is fragmented, and the winning strategy is to identify the segment and street where demand still outpaces supply.
That is exactly how we approach property at Ripehouse Advisory: with suburb-level and street-level data, not broad averages.
If Brisbane’s citywide median is masking that split, the next question is how to separate tight suburbs from oversupplied stock before you buy. Ripehouse Advisory webinar attends to the suburb-level signals that matter.
Frequently asked questions
Why can Brisbane property prices fall in the headlines while some suburbs still look strong?
Because a citywide median blends very different markets together. The article says some parts of Greater Brisbane still have tight supply, low vacancy and strong owner-occupier demand, so the average can hide local strength.
What does the article say is the main risk in Brisbane’s softer unit market?
The main risk is oversupply in specific segments, especially inner-city units and older buildings with heavy body corporate costs. The article says rising listings can signal pressure in those areas even if other suburbs remain tight.
Why is Windaroo mentioned as an example of a Brisbane suburb that is not following the citywide trend?
Windaroo, Queensland 4207 in Logan City, has very low vacancy at 0.6%, strong owner-occupier presence, short days on market and sold prices up 3.3% over the quarter. The article uses it to show that local data can point to a much tighter market than the Brisbane average.
What local data should buyers look at instead of relying only on Brisbane’s median price?
The article says to look at vacancy, yield, days on market, owner-occupier rate and sale velocity together. These measures help separate oversupplied stock from structurally tight suburbs.
What is the practical takeaway for someone trying to buy in Brisbane right now?
Don’t buy the headline; buy the micro-market. The article’s message is to focus on the specific suburb or street, because demand and supply can be very different within Greater Brisbane.
General information only. It does not take your objectives, financial situation or needs into account, and nothing here is legal, financial, taxation or investment advice specific to your circumstances.