News · 25 August 2026 · 5 min read
“The suburb was booming. Then one flood line erased $78,000 from his house.”
A homeowner discovered that the risk investors price is often drawn street by street, not suburb by suburb.
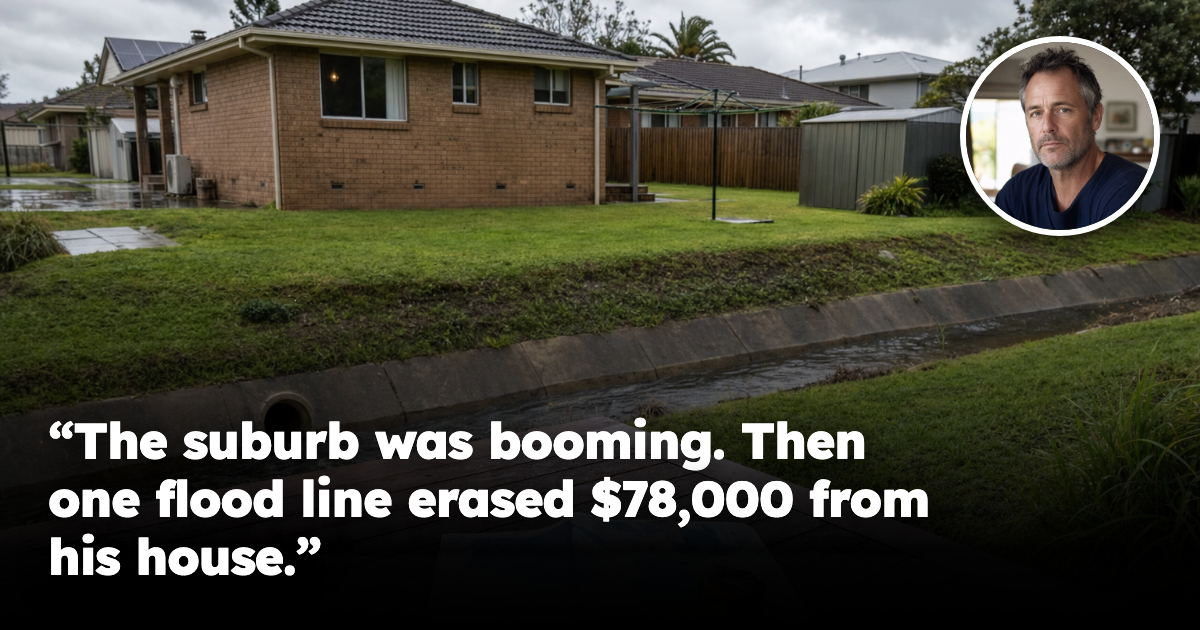
The suburb was booming. Then one flood line erased $78,000 from his house.
The house looked like the safe purchase.
It was on a quiet street, close to shops, with a renovated kitchen and enough backyard for the two children who spent alternate weeks there. The surrounding suburb had been climbing. New listings were being absorbed quickly. The house next door had sold for more than anyone expected.
Then a buyer’s report drew a line through the address.
Not through the suburb. Not even through the whole street. Through the rear third of the block.
The owner, a 52-year-old father rebuilding his finances after a divorce, had bought the property for $742,000. Eighteen months later, a comparable home two streets away sold for $820,000. He expected his own valuation to be close.
It came back at $742,000.
The difference was not a cracked slab or a collapsing roof. It was the way a flood-risk layer, insurance history and site elevation combined around his particular lot. The market had not rejected the suburb. It had separated one piece of land from the story being told about the suburb.
His question was blunt: “If the whole area is growing, how can one line on a map wipe out $78,000?”
The answer is that property is not priced by the suburb name alone.
The map does not need to cover the whole block
Flood risk is often discussed as though an address is either “in a flood area” or “not in one”. Buyers quickly discover that the useful question is more precise: which part of the lot is affected, at what level, and with what consequence for the building, access, drainage, future works and insurance?
A line can cross a rear yard without touching the living areas. That does not make it irrelevant. It can restrict extensions, alter the usable outdoor area, complicate a future subdivision, change the buyer pool or prompt an insurer to ask more questions. A driveway that remains passable in ordinary weather may become a resale concern if the only access route is the low point on the street.
The risk is not automatically a disaster. It is a pricing input. The mistake is treating it as a suburb-wide label and then assuming every property carries the same discount.
Why the neighbour can sell for more
Two homes may share a postcode, school zone, council, median and growth headline while presenting very different investment assets.
One may sit on the high side of a street, have a dry garage, two reliable access points and a building footprint outside the relevant overlay. The other may have a lower rear boundary, a single access route and a yard that limits the next renovation.
When the market is rising, the difference can hide inside enthusiastic comparable sales. When a cautious buyer, lender or insurer examines the specific address, the hidden difference becomes visible at once.
That is what happened to him. The $78,000 was not necessarily a permanent mathematical discount attached to every future sale. It was the gap between the price he paid for a broad suburb narrative and the price the next buyer was prepared to pay after testing the actual block.
The first lesson is not “never buy near water”. It is “never buy a risk profile you have not measured”.
Insurance is part of the location story
His renewal notice had already hinted at the problem. The annual premium had risen from $2,900 to $6,740, and the excess structure was more complicated than the policy he had accepted at purchase. He had filed no claim. The house had not moved. But the risk model used by the insurer had changed the cost of holding the asset.
That cost affects yield. It affects the amount a buyer can borrow comfortably. It affects which tenants or owner-occupiers remain interested. And it affects how confidently a valuer can compare the property with a similar-looking home on higher ground.
A rent estimate that ignores insurance, flood-related maintenance, access and the usable portion of the block is not a yield calculation. It is a suburb average wearing a property address.
That same trap appears in other physical features. A driveway can look permanent until the legal access decision is examined, as we covered in the main-road access story. A location can also carry a risk that only becomes obvious when its exact boundary is tested, the same reason street-level planning exposure matters.
What street-level checking looks like
At Ripehouse Advisory, the useful comparison is not simply “this suburb versus that suburb”. It is the best and worst streets inside the same suburb, then the actual property against its nearest real alternatives.
That means testing the lot boundary, contour, access points, drainage direction, surrounding low points, recent comparable sales and the cost of carrying the asset. It means checking whether the risk affects the home itself or only a corner of land, and whether the issue changes what can be built or only what can be insured.
The same approach applies to other micro-location factors: a noisy intersection, an easement, a flight path, a high-voltage corridor or a school boundary that changes halfway down the road. Street-level data often reveals a 20–30% effective-yield spread between the best and worst streets in one suburb. The median cannot explain that spread because the median cannot see the block.
For investors, the practical sequence is simple:
- Obtain the current risk layers for the exact address, not a screenshot for the suburb.
- Ask an insurer for an indicative premium and excess before making the offer unconditional.
- Check access, building footprint, future works and drainage with the same care as the bedrooms and bathrooms.
- Compare the property with nearby sales that share its physical risk profile, not merely its postcode.
- Re-run the yield using the actual holding costs.
His $78,000 gap became less frightening once it was measurable. The purchase had not become worthless. It had become a different asset from the one he thought he was buying.
That distinction is where investors either lose money or find an edge. A broad headline can make a suburb look safe, cheap or unstoppable. A street-level check tells you which addresses can actually deliver the return, liquidity and future options you are paying for.
Property remains a powerful long-term investment because land, access and demand can compound over time. But the right asset is not “a house in a good suburb”. It is the right block, on the right street, with the risks priced before settlement. The investor who measures the line on the map is often the one who can buy with confidence when everyone else is reacting to the headline.
If there's a specific street you're weighing up right now, check its Street Score first — it's free, takes ten seconds, and tells you whether that street is pulling the suburb average up or riding on it.
Frequently asked questions
Why did one flood line reduce the value of the house even though the suburb was still booming?
Because property is priced at the address level, not just by suburb. In this case, a flood-risk layer, insurance history and site elevation affected that specific lot, so the market treated it differently from nearby homes.
Does a flood overlay have to cover the whole block to affect a property’s value?
No. The article says a line can cross only part of a lot, such as the rear yard, and still affect resale value, insurance, future works, access or subdivision potential.
Why can a neighbour’s house sell for more if it is in the same street and suburb?
Two homes can share the same postcode and growth story but have very different physical risks. A higher block, better access, no relevant overlay or a drier garage can make one property more attractive to buyers, lenders and insurers.
How does flood risk affect more than just the purchase price?
It can also raise insurance premiums, change excesses, affect borrowing comfort and reduce the pool of buyers or tenants. Those holding costs and limits feed into the property’s real yield.
What should an investor check before buying a property with possible flood exposure?
The article says to check the exact risk layers for the address, get an indicative insurance premium and excess, review access, drainage and building footprint, and compare the property with nearby sales that share the same physical risk profile.
General information only. It does not take your objectives, financial situation or needs into account, and nothing here is legal, financial, taxation or investment advice specific to your circumstances.