News · 31 August 2026 · 3 min read
Weekly Rents: Perth Rises, Brisbane Pauses — Week Ending 30 August 2026
National advertised weekly rents eased $1.88 to $774.84 in the week ending 30 August 2026 — still up 7.1% on a year ago. Perth was the only capital where every segment rose (units now 8.7% up annually), Brisbane gave back ground after a strong run, and Darwin houses hold the strongest annual growth of any capital at 10.1%. Full data inside.
(~600 words)
National rents ease, but annual growth remains positive
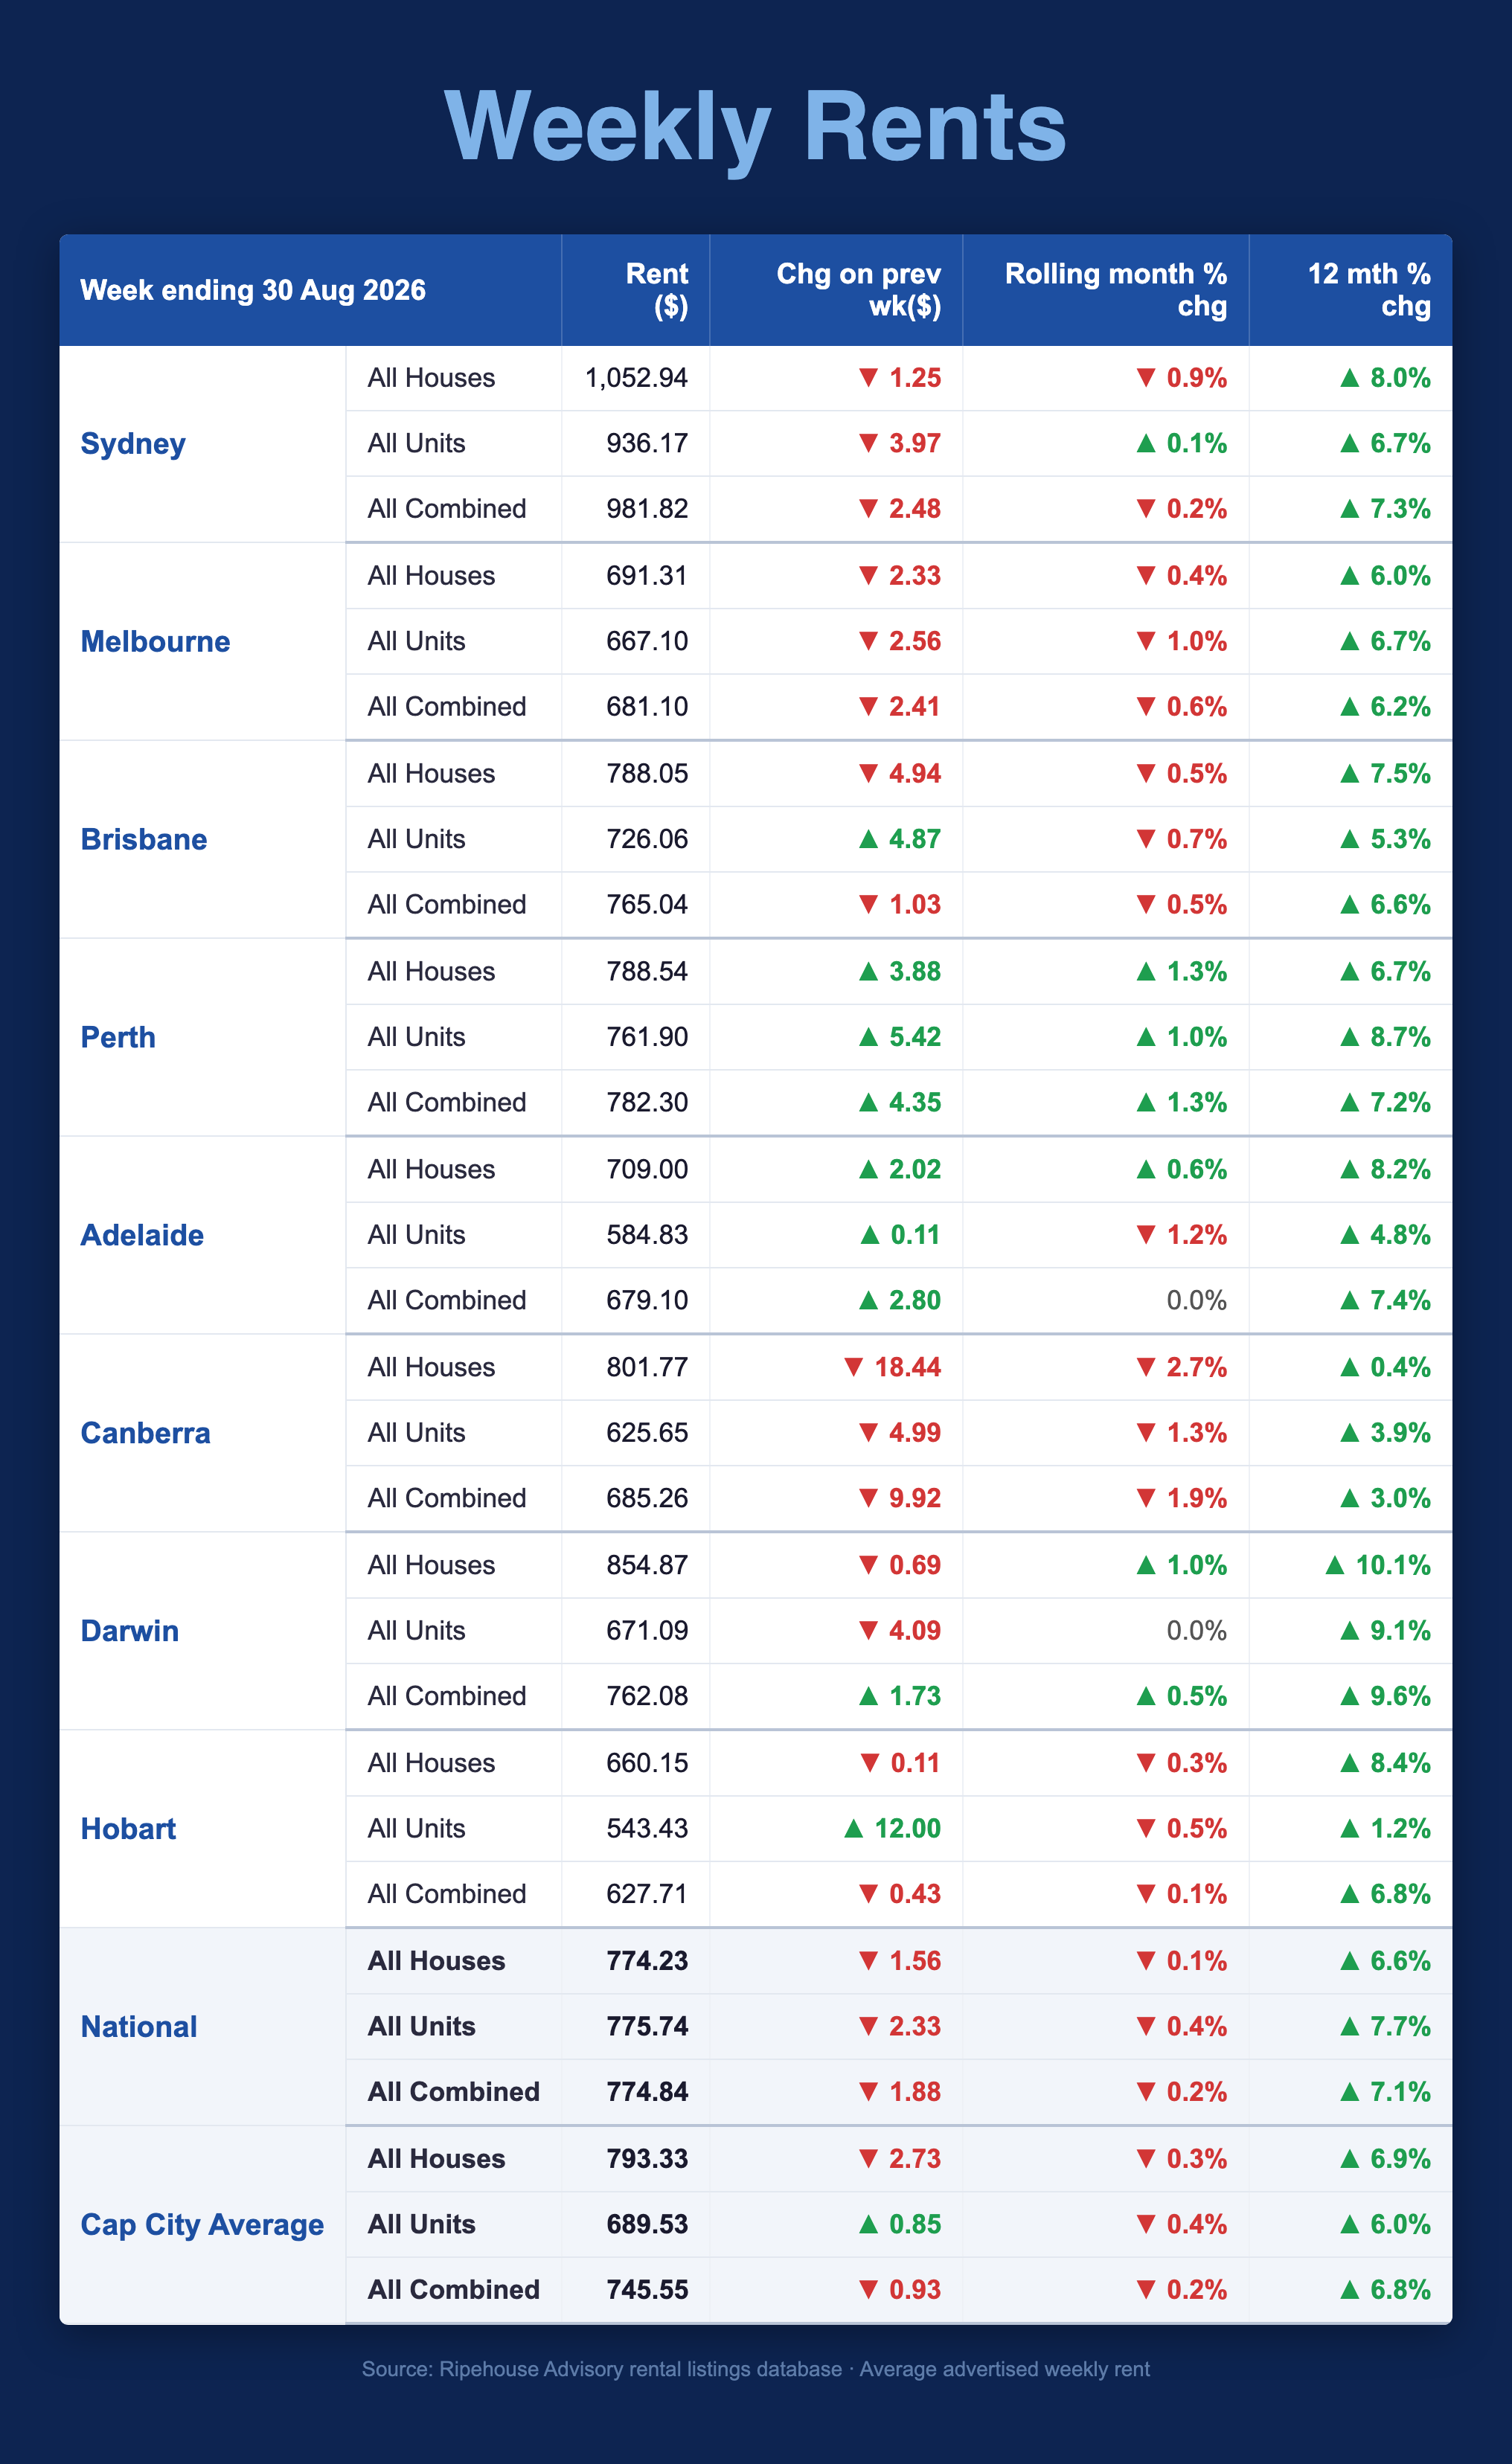
The Ripehouse Advisory rental listings database recorded a softer week nationally. The combined national asking rent was $774.84 for the week ending 30 August 2026, down 1.88% on the previous week. Despite that weekly decline, the national combined figure was 7.1% higher than a year earlier.
The weekly result was slightly different across dwelling types. National house rents were $774.23, down 1.56%, while unit rents were $775.74, down 2.33%. Over 12 months, houses increased 6.6% and units increased 7.7%. The cap city average was $745.55 combined, down 0.93% for the week and up 6.8% over 12 months.
Perth and Adelaide move higher
Perth recorded the strongest broad-based weekly increase among the capital city markets in this dataset. Combined rents rose 4.35% to $782.30. House rents increased 3.88% to $788.54, while unit rents increased 5.42% to $761.90. Perth's combined figure was 7.2% above its level a year earlier.
Adelaide also moved higher, with combined rents up 2.80% to $679.10. Houses rose 2.02% to $709.00 and units were almost unchanged, increasing 0.11% to $584.83. The combined annual increase was 7.4%, with house growth at 8.2% and unit growth at 4.8%.
Darwin's combined rent increased 1.73% to $762.08. The annual comparison was the strongest of the combined city results at 9.6%. Houses were $854.87, down 0.69% for the week but up 10.1% over 12 months. Units were $671.09, down 4.09% weekly and up 9.1% annually.
Canberra records the largest weekly fall
Canberra was the largest weekly mover in the other direction. Combined rents fell 9.92% to $685.26. House rents declined 18.44% to $801.77, while unit rents fell 4.99% to $625.65. The annual combined increase was more moderate at 3.0%.
Brisbane also showed a clear split between dwelling types. Combined rents were down 1.03% to $765.04, but house rents fell 4.94% to $788.05 while unit rents rose 4.87% to $726.06. The combined result was still 6.6% above the same point last year.
Sydney remains the highest combined market
Sydney remained the highest combined market in the dataset at $981.82, despite a 2.48% weekly decline. House rents were $1,052.94 and unit rents were $936.17. The annual combined increase was 7.3%.
Melbourne's combined rent fell 2.41% to $681.10, with houses at $691.31 and units at $667.10. The combined annual increase was 6.2%.
Hobart was broadly stable at $627.71 combined, down 0.43% for the week and up 6.8% over 12 months. House rents were almost unchanged at $660.15, while unit rents rose 12.00% to $543.43. The unit movement did not translate into a material change in the combined figure.
What this means
This week's data is a reminder to separate short-term movement by dwelling type from the broader annual trend. National rents eased, but remained 7.1% above the prior year. Perth, Adelaide and Darwin recorded weekly increases, while Canberra recorded the sharpest decline. Brisbane and Hobart showed particularly strong house-versus-unit divergence, making the combined figure less informative on its own.
The figures are from the Ripehouse Advisory rental listings database.
The full data — week ending 30 August 2026
| City | Dwelling | Avg Weekly Rent | Chg on Prev Wk | Rolling Mth | Chg 12 Mth |
|---|---|---|---|---|---|
| Sydney | All Houses | $1052.94 | -$1.25 | -0.9% | +8.0% |
| Sydney | All Units | $936.17 | -$3.97 | +0.1% | +6.7% |
| Sydney | All Combined | $981.82 | -$2.48 | -0.2% | +7.3% |
| Melbourne | All Houses | $691.31 | -$2.33 | -0.4% | +6.0% |
| Melbourne | All Units | $667.10 | -$2.56 | -1.0% | +6.7% |
| Melbourne | All Combined | $681.10 | -$2.41 | -0.6% | +6.2% |
| Brisbane | All Houses | $788.05 | -$4.94 | -0.5% | +7.5% |
| Brisbane | All Units | $726.06 | +$4.87 | -0.7% | +5.3% |
| Brisbane | All Combined | $765.04 | -$1.03 | -0.5% | +6.6% |
| Perth | All Houses | $788.54 | +$3.88 | +1.3% | +6.7% |
| Perth | All Units | $761.90 | +$5.42 | +1.0% | +8.7% |
| Perth | All Combined | $782.30 | +$4.35 | +1.3% | +7.2% |
| Adelaide | All Houses | $709.00 | +$2.02 | +0.6% | +8.2% |
| Adelaide | All Units | $584.83 | +$0.11 | -1.2% | +4.8% |
| Adelaide | All Combined | $679.10 | +$2.80 | 0.0% | +7.4% |
| Canberra | All Houses | $801.77 | -$18.44 | -2.7% | +0.4% |
| Canberra | All Units | $625.65 | -$4.99 | -1.3% | +3.9% |
| Canberra | All Combined | $685.26 | -$9.92 | -1.9% | +3.0% |
| Darwin | All Houses | $854.87 | -$0.69 | +1.0% | +10.1% |
| Darwin | All Units | $671.09 | -$4.09 | 0.0% | +9.1% |
| Darwin | All Combined | $762.08 | +$1.73 | +0.5% | +9.6% |
| Hobart | All Houses | $660.15 | -$0.11 | -0.3% | +8.4% |
| Hobart | All Units | $543.43 | +$12.00 | -0.5% | +1.2% |
| Hobart | All Combined | $627.71 | -$0.43 | -0.1% | +6.8% |
| National | All Houses | $774.23 | -$1.56 | -0.1% | +6.6% |
| National | All Units | $775.74 | -$2.33 | -0.4% | +7.7% |
| National | All Combined | $774.84 | -$1.88 | -0.2% | +7.1% |
| Cap City Average | All Houses | $793.33 | -$2.73 | -0.3% | +6.9% |
| Cap City Average | All Units | $689.53 | +$0.85 | -0.4% | +6.0% |
| Cap City Average | All Combined | $745.55 | -$0.93 | -0.2% | +6.8% |
Average advertised weekly rent across all listings available during the week, Ripehouse Advisory rental listings database. Week runs Monday to Sunday; capital cities defined by GCCSA boundaries.
If there's a specific street you're weighing up right now, check its Street Score first — it's free, takes ten seconds, and tells you whether that street is pulling the suburb average up or riding on it.
Market data & R-Scores for locations in this article
Drill Down Into the Markets Mentioned Above
Inspect live monthly R-Scores, median prices, rental yields, and street-by-street scores for the cities and council areas referenced in this article:
Frequently asked questions
Why did national rents fall this week if annual rent growth is still strong in Australia?
National advertised weekly rents eased to $774.84 for the week ending 30 August 2026, but they were still 7.1% higher than a year earlier. The article notes that short-term moves can differ from the broader annual trend.
Which capital cities recorded the strongest rent increases for the week ending 30 August 2026?
Perth recorded the strongest broad-based weekly increase, with combined rents up 4.35%. Adelaide also rose, and Darwin’s combined rent increased 1.73%.
What happened to Brisbane rents after its recent run of growth?
Brisbane’s combined rents fell 1.03% for the week to $765.04. Houses fell 4.94% while units rose 4.87%, so the city showed a clear split between dwelling types.
Which city had the sharpest weekly drop in rents?
Canberra recorded the largest weekly fall in the dataset, with combined rents down 9.92% to $685.26. Houses fell 18.44% and units fell 4.99%.
What should readers pay attention to when looking at this rental data?
The article says it is important to separate short-term changes by dwelling type from the broader annual trend. It also notes that house-versus-unit divergence in places like Brisbane and Hobart can make the combined figure less informative on its own.
General information only. It does not take your objectives, financial situation or needs into account, and nothing here is legal, financial, taxation or investment advice specific to your circumstances.