News · 30 September 2026 · 5 min read
'Rates are the highest since 2011. Do I use my $90,000 to pay down the loan, or wait?'
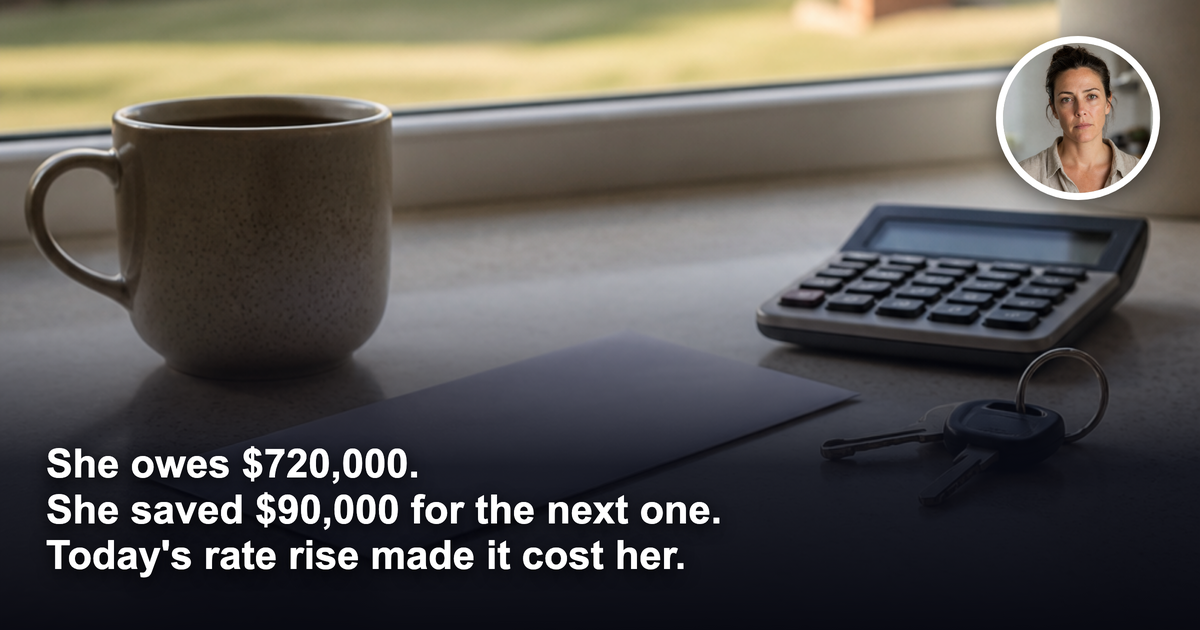
She is 36. She owns her home, bought in 2020, and one rental she picked up in 2023. Between the two loans she owes about $720,000. Both are variable. Both are with the same bank that, this week, passed on the Reserve Bank's latest rise in full.
She is 36. She owns her home, bought in 2020, and one rental she picked up in 2023. Between the two loans she owes about $720,000. Both are variable. Both are with the same bank that, this week, passed on the Reserve Bank's latest rise in full.
She is a composite, drawn from the questions that landed in our inbox in the hours after the RBA's decision. But her numbers are the shape of a very common household right now.
Here is the part that matters. She has been careful. She rounds up her repayments. She has trimmed the streaming services and the second car. And, over four years, she has put away $90,000 in a high-interest savings account, earmarked for the deposit on the next property.
Then the RBA lifted the cash rate to its highest level since 2011, and the major banks moved their variable rates within hours (ABC News, 30 September 2026).
### The question she sent us
*"Rates just went up again and I'm reading it's the highest since 2011. I've got $90,000 saved for the next one. Do I throw it at the mortgage now, keep it for the deposit, or just stop and wait until this settles down?"*
Three options. All of them about timing. None of them about structure.
That is the tell. Almost every message we received this week was framed the same way: what do I do with the money, and when. Nobody asked where the money lives.
### The answer: the $90,000 has been costing her for four years
We are not going to tell her what to do with her savings. That is personal advice and she should get it from someone who has seen her full position.
But there is a structural fact sitting in plain sight, and it is not advice to point at it.
Her $90,000 is in a savings account. Her $720,000 of debt is in two variable loans. Every month, the bank calculates interest on the full loan balance and pays her whatever it chooses on the savings. The savings interest is taxed as income. The loan interest is charged at a home-loan rate that just went up again.
If that same $90,000 sat in an offset account attached to one of those loans, interest would be calculated on $90,000 less. The cash would still be hers. Still available for the deposit. Still liquid on the day she needs it.
She would have given up nothing. She has been giving up the difference between two rates, every month, since 2022. And this week that difference got wider.
The rise in the headline is real. But she did not need a rate rise to be paying more than she had to. The structure was doing that quietly the whole time. The rise just made it loud.
### What a rate cycle actually tests
There is a story that gets told every time rates move: the disciplined households cope and the careless ones sell.
We do not think that is what the data shows. What we see, portfolio after portfolio, is that rate cycles test structure.
Two owners with the same income, the same debt and the same habits can be in completely different positions at the same cash rate, because one of them set the loans up to absorb a cycle and the other set them up for the rate on offer that day.
Some of the structural questions that matter more this week than they did last week:
Is there an offset, and is the cash actually in it?
Is everything variable, everything fixed, or deliberately split?
Are the investment and owner-occupier loans separated cleanly, or tangled in a way that will cost at tax time?
Is there a buffer that survives another rise, or does the buffer only work at the rate you got approved at?
None of those is about whether to buy. All of them are about whether what you already hold can carry you through the next twelve months without a forced decision.
### What it means for you
If you own a home with equity and you are between 32 and 48, this rise arrived at an awkward moment. You are probably at or near your peak borrowing years. You probably have some cash. And you are probably being told two contradictory things at once: that it is a buying window, and that you should sit tight.
Both of those are timing calls. Ignore them for a week.
The better question is the one she should have asked: is the structure I already have resilient at these rates? If the answer is no, the next purchase is not the problem. If the answer is yes, the next purchase is a much calmer conversation.
And where you buy still matters more than when. Two streets in the same suburb can be having completely different outcomes through the same rate cycle: one full of stretched recent buyers, one full of long-held homes with almost no stock. The headline is national. Your asset is on a street.
### The Ripehouse reframe
We measure our clients' portfolios on a five-year rolling basis, which means every published result already contains a full rate cycle, including the rises since 2022. Across 997 client portfolios since 2021, median portfolio growth has run at 19.0 per cent a year on that basis, against roughly 6.3 per cent for the combined capitals.1 We publish the full distribution, including the portfolios that underperformed.
Past performance is not a guarantee of future results.
That result did not come from calling the cash rate. It came from the right asset, on the right street, held inside a structure that was built for cycles rather than for one good month.
If you are behind where you thought you would be at this point, that is usually a structure problem, not a discipline problem. It is fixable. But it is fixable at the level of how the loans and the assets are arranged, not at the level of trying harder.
She was trying hard enough. She just had $90,000 in the wrong account.
15-minute Legacy Sequence Diagnostic: ripe.house/4bV7I8u. No pressure. No obligation. Just a clearer picture than you had before.
---
1 Combined-capitals benchmark: CoreLogic/Cotality. RHA figures are median portfolio growth, 5-year rolling basis, rounded down. General information only, not personal financial advice.
General information only. It does not take your objectives, financial situation or needs into account, and nothing here is legal, financial, taxation or investment advice specific to your circumstances.