News · 1 October 2026 · 5 min read
He signed for $640,000 three weeks ago. Should he forfeit $64,000 to escape the '40-year downturn'?
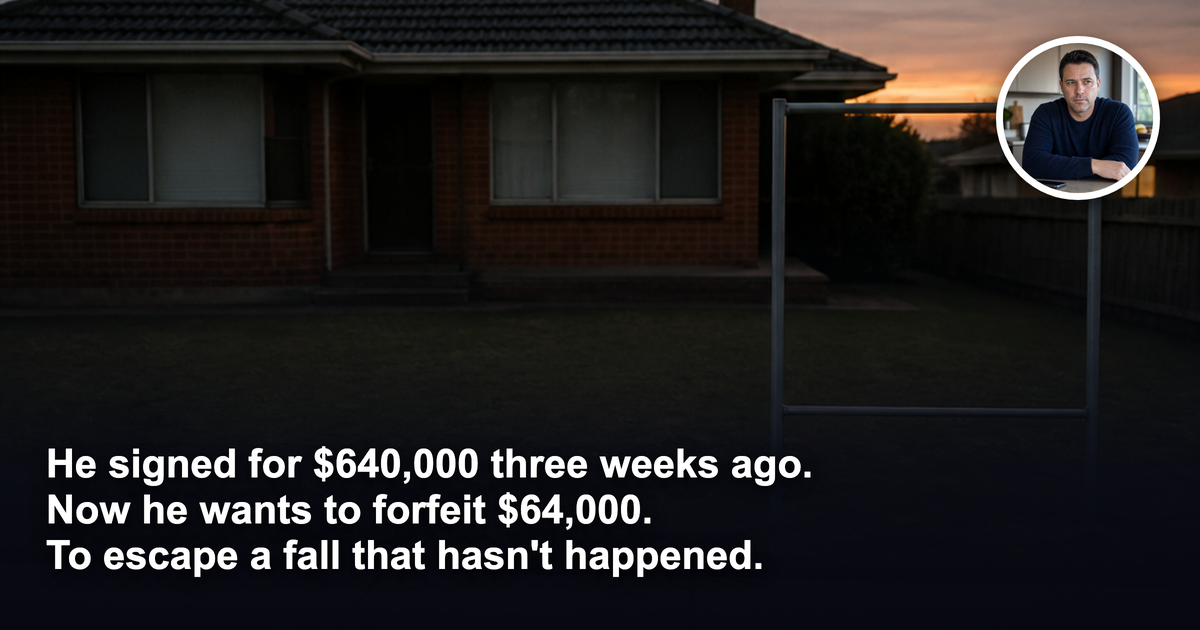
He is 40. Married, one daughter in Year 2, a family home in the suburbs with a decent slab of equity in it after seven years of paying it down.
He is 40. Married, one daughter in Year 2, a family home in the suburbs with a decent slab of equity in it after seven years of paying it down.
In August he finally did the thing he had been talking about for three years. He signed a contract on a $640,000 investment property interstate, paid a 10 per cent deposit, and went unconditional on the strength of a pre-approval and a clean building report. Settlement is in November.
Then came October 1.
Cotality's September numbers landed, the ABC ran them under the words "biggest property downturn in 40 years", and by lunchtime three people had sent him the link.
He is a composite, drawn from the questions that arrived in our inbox this week. The numbers in his question are the numbers in theirs.
### The question he sent us
*"I've gone unconditional on a $640,000 investment property. Settlement is six weeks away. Now I'm reading values could fall 10 to 15 per cent and this is the biggest downturn in 40 years. If I walk away I lose my $64,000 deposit. If I settle, am I catching a falling knife? Which loss is smaller?"*
We are not his solicitor and this is not advice about his contract. But the arithmetic he is doing deserves to be taken apart, because a lot of people are doing a version of it right now.
### The numbers, straight
Cotality's Home Value Index fell 1.1 per cent in September. That is six straight monthly falls, and values now sit 5.2 per cent below the March peak.
Brisbane had the sharpest monthly drop of the capitals at 1.5 per cent. Sydney fell 1.4 per cent, Melbourne 0.7 per cent. Darwin, up 0.4 per cent, was the only market that did not fall.
Across the capitals, 97 per cent of suburbs recorded declines over the past three months.
Cotality's Tim Lawless told the ABC a 10 to 15 per cent fall is "a fairly reasonable estimate", with values continuing to slide into 2027 on the back of four rate rises this year. AMP's Shane Oliver put a worst case at 20 per cent if the Iran war drags on, oil hits $150 a barrel and people start losing jobs. He is the source of the 40-year line.
He also said something that did not make the headline: "We're not there yet. The worst-case scenarios in the past few years have been an 8 per cent top-to-bottom fall."
Hold onto that sentence.
### The answer: one of these losses is a forecast. The other is a cheque.
If he walks away, $64,000 leaves his life on a single day. It is certain. It is cash. In most states a vendor who resells for less can also pursue the shortfall, so $64,000 is the floor of that outcome, not the ceiling.
If he settles, he owns a house whose number on an index may read 10 to 15 per cent lower sometime in 2027. That number is a snapshot of a ratio. It is not a transaction. It costs him nothing until the day he sells, and he is not buying to sell in 2027.
Look at what he is proposing. The forecast fall is 10 to 15 per cent. His deposit is 10 per cent. He would be paying the forecast in advance, in real money, to avoid the possibility of it arriving on paper.
That is the expensive mistake. Not buying in a downturn. Paying a guaranteed loss to escape a predicted one.
### The number nobody has ever bought
The 10 to 15 per cent is a forecast for a national index. Nobody has ever bought a national index.
His contract is for one house on one street. "97 per cent of suburbs fell" tells you the cycle is broad. It tells you nothing about what is happening inside those suburbs, where the gap between streets is usually wider than the gap between cities.
Two streets in the same suburb can be having completely different outcomes right now. One has a developer discounting unsold new stock and a line of identical rentals competing for the same tenant. The other has established homes, almost nothing for sale, and a tenant signing within a fortnight.
Both streets sit inside the same red cell on the heatmap. Only one of them is a problem.
So the honest question for our composite is not "will the market fall". It is "which street did I buy". If the answer is the first street, the headline is the least of his worries, and he had that problem in August. If it is the second, the headline is noise.
### What 40 years actually contains
Forty years takes in the early-nineties recession, 2008, the 2017 to 2019 correction and the 2022 rate shock. Each one was described, at the time, as the end of something. Oliver's own figure is that the worst of the recent cycles ran 8 per cent top to bottom.
We make no prediction about where this one bottoms. We do not need to.
### What we publish instead of predictions
Since 2021 we have built 997 client portfolios: $634M+ invested across 1,352 properties, $288M+ in client wealth created. The median portfolio has grown 19.0 per cent a year on a five-year rolling basis, against roughly 4.3 per cent nationally.1
That five-year window runs straight through the 2022 to 2023 downturn. We did not time it. Our clients did not sit in cash waiting for a signal. They bought specific assets on specific streets, with structures built to be held through a full cycle, and we publish the full distribution of what happened next, including the portfolios that underperformed.
That is the reframe. A downturn punishes the wrong asset and the wrong structure. It is largely indifferent to the right ones. The right street, the right asset and the data beat the headline every cycle we have records for. Structure, not timing.
If you are mid-contract, or sitting on equity and now frozen, the useful exercise is not reading forecasts. It is running your actual asset and your actual structure against a 2027 that looks the way Lawless describes, and seeing whether it holds.
15-minute Legacy Sequence Diagnostic: ripe.house/4bV7I8u. No pressure. No obligation. Just a clearer picture than you had before.
1 National benchmark: CoreLogic/Cotality Home Value Index. Past performance is not a guarantee of future results.
General information only. It does not take your objectives, financial situation or needs into account, and nothing here is legal, financial, taxation or investment advice specific to your circumstances.