News · 15 September 2026 · 4 min read
New Logan leases are $13,520 a year dearer than 2021. Which streets actually held?
New Logan bond lodgements hit a $620 median in June 2026 - $260 a week, or $13,520 a year, above 2021. A 0.8% regional vacancy rate explains the pressure but not the outcome. The street-level numbers that decide which asking prices are real.
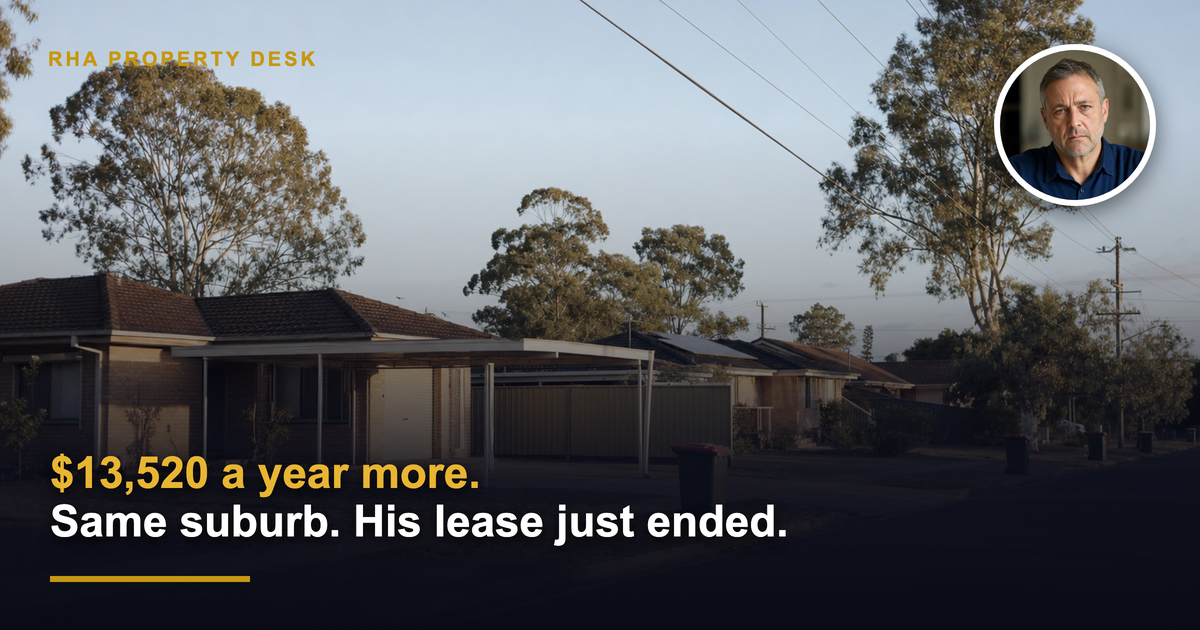
A man of 54 walked into an inspection in Logan this winter with the same budget he had carried for years and discovered the market had moved without him. He was not upgrading. He was not chasing a better postcode. His old lease had ended, that was all, and re-entering the market as a new tenant turned out to be the most expensive thing he could have done.
The number behind that is not a feeling. Residential Tenancy Authority bond records show the median weekly rent across all new Logan bond lodgements reached $620 in June 2026 — $260 a week above the June 2021 figure. Across 52 weeks, that is $13,520. Three-bedroom houses rose $230 to $600 a week. Three-bedroom units rose $230 to $580. Two-bedroom units rose $180 to $480. Houses with four bedrooms or more climbed $260, from $430 to $690.
Those figures cover new bond lodgements. That is the quiet unfairness in the data. A sitting tenant absorbs increases in steps. A tenant whose lease ends absorbs five years of the market in a single signature.
The question worth asking
The obvious response is that the whole region got dearer, so there is nothing to choose between one address and another. That is where most people stop, and it is where most of the money is lost — by renters, and by the investors who buy on the same headline.
The Real Estate Institute of Queensland recorded a Logan vacancy rate of 0.8% in the June quarter, against its own nominated healthy range of 2.6% to 3.5%. A McGrath property manager quoted in local coverage put it plainly: there are so many tenants and such high demand that asking prices are being achieved, because people need housing. Anglicare Southern Queensland's April snapshot found most low-income household types assessed across Logan–Beaudesert had no affordable and appropriate rentals available at all.
So the pressure is real. But 0.8% is a regional average, and a regional average is the least useful number in property. It is the answer to a question nobody actually faces. Nobody rents a region. Nobody buys one either.
What the average hides
Inside a single Logan suburb, the spread between streets is routinely wider than the spread between suburbs. We see it every week in the street-level work:
- Achieved rent versus advertised rent. The advertised figure is an opinion. The achieved figure is the transaction. On tight streets the two converge; on weak streets a $620 ask is settling at $585 after three weeks of vacancy, and the landlord never reports it.
- Street-level vacancy. A suburb at 0.8% can contain a street sitting at 3% because a single block of near-identical units turns over together. That street has no pricing power, and its tenants have options the suburb average says they do not have.
- Days on market for that stock type. Four-bedroom houses and two-bedroom units in the same postcode behave like different asset classes. The $260 jump on four-bedroom houses and the $180 jump on two-bedroom units are not the same market moving; they are two markets moving at different speeds.
- Approved-but-unbuilt competing supply. The rent on a street with 140 approved dwellings at the end of it is borrowed. The rent on a street that is physically full is earned.
- Buyer depth on exit. The number that decides whether an investor keeps the gain. Thin buyer depth turns a strong yield into a slow sale.
Run those five on our 54-year-old's shortlist and the $13,520 stops being one number. It becomes a range. Two of the homes he inspected were genuinely priced by scarcity. One was priced by the headline — an owner reading the same regional vacancy rate he was, on a street with more turnover, older competing stock and a development approval two corners away.
He had no way of telling them apart from the listing. That is the injustice in this story, and it is not confined to renters. It is an information asymmetry, and it points in exactly one direction: away from the person with the least data.
What it means if you are buying, not renting
An investor reading "$13,520 higher" and "0.8% vacancy" and buying anything in Logan has made the same mistake as the tenant, with more money at stake. Regional scarcity is not a thesis. It is context.
The R-Score and street heatmaps exist because the difference between the right street and the street next to it, in the same suburb, at the same price, is the difference between an asset that holds rent through a soft patch and one that hands it straight back. Rent growth driven by genuine, street-level scarcity survives a supply cycle. Rent growth borrowed from a regional headline does not.
That is the reframe worth taking away. The headline moves in years; the street decides the outcome. The right asset, on the right street, chosen on data rather than on a regional average, is still the most reliable way to own Australian property — and it is precisely what the person with only the headline cannot do.
The check to run before you sign anything
Before the next lease or the next contract, get the four numbers the listing will never show you: achieved rent on that street, street-level vacancy, days on market for that exact stock type, and the approved supply within a kilometre. If the street cannot justify the asking figure on its own evidence, the figure is borrowed.
Ripehouse Advisory builds those numbers street by street. If you would like your shortlist run properly before you commit, that is the work.
If the street cannot justify the asking figure on its own evidence, the figure is borrowed. Attend the Ripehouse Advisory webinar to see how achieved rent, street vacancy and approved supply can help separate genuine scarcity from listings priced off the regional headline.
Frequently asked questions
Why are new Logan leases so much higher than existing tenancies for renters coming back into the market?
The article says new bond lodgements in Logan hit a median $620 a week in June 2026, which is $260 a week above June 2021. Sitting tenants usually absorb increases in steps, while a tenant whose lease ends has to meet the market all at once.
Does Logan’s 0.8% vacancy rate tell me whether a particular rental asking price is fair?
No. The article says 0.8% is only a regional average, and regional averages are the least useful number in property. Street-level conditions can be very different, so the asking price has to be tested against the specific street and stock type.
What street-level checks does the article say matter before accepting a Logan rental or investment price?
It says to check achieved rent on that street, street-level vacancy, days on market for the exact stock type, and approved supply within a kilometre. If the street cannot justify the asking figure on its own evidence, the figure is likely borrowed from the broader market.
Why can two streets in the same Logan suburb have very different rental outcomes?
Because suburb averages can hide big differences between streets. A single block of similar units turning over together, older competing stock, or nearby approved supply can change vacancy, pricing power and days on market even when the suburb-wide figure looks tight.
What is the main risk for an investor buying in Logan off the regional vacancy headline alone?
The article warns that regional scarcity is not a full investment thesis. A property priced off the headline rather than street-level data may not hold rent through a softer patch, and thin buyer depth on exit can make the eventual sale slower.
General information only. It does not take your objectives, financial situation or needs into account, and nothing here is legal, financial, taxation or investment advice specific to your circumstances.