News · 14 September 2026 · 5 min read
Seven in ten homes are waiting on urgent repairs. So where did $250 million go?
A new report found almost seven in ten public housing tenants in WA’s Kimberley are waiting on urgent repairs, while about $250 million has gone on travel and overheads since 2019. The money moved. The repairs did not. There is a structural lesson in it for every property owner.
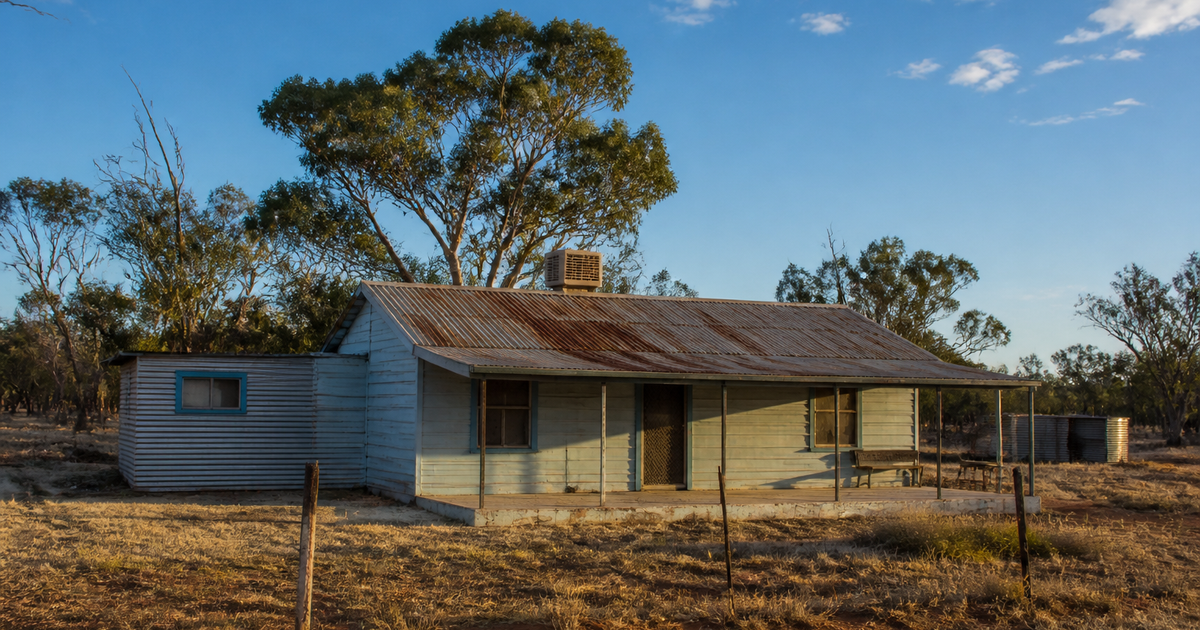
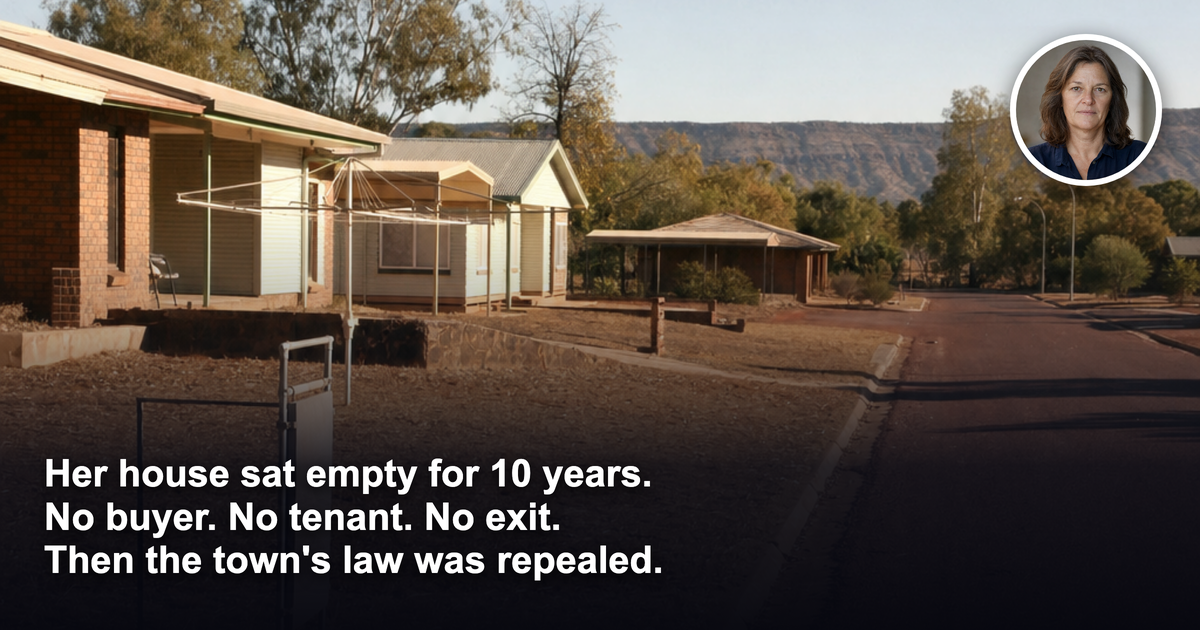
A report released this week found that almost seven in ten public housing tenants in Western Australia's Kimberley are waiting on urgent repairs — plumbing, electrical, structural. Not cosmetic complaints. The things that make a house a house.
The same report found that since 2019, about $250 million has been spent on travel and overhead costs associated with housing maintenance in the region.
Read those two numbers next to each other and you have the whole story.
The person
She is 46. She has lived in the same house in a remote community for years, and she is not allowed to fix it herself — tenants in the system cannot organise their own repairs, and essential work has to be signed off and carried out through an official chain.
So she did what she was supposed to do. She rang it in. Her shower floor was collapsing; run the water and it poured out underneath the slab.
What eventually arrived, in one case the report documents at Beagle Bay, was a broken shower patched with a bucket lid.
She stands in for 166 tenants across 22 communities who told the same story in different houses.
The question
How does a quarter of a billion dollars get spent on maintenance and leave seven in ten homes still waiting?
The answer, with numbers
The Kimberley Community Legal Service surveyed 166 public housing tenants across 22 communities for its Broken by Design report. More than 95 per cent of them did not consider their homes to be safe or in good condition. Over half of all Kimberley renters live in social housing, so this is not a fringe cohort — it is the housing market for most people in the region.
The $250 million figure is the part that should stop you. It is not what was spent on repairs. It is what was spent on travel and overheads associated with repairs since 2019. The money moved. The trades moved. The showers did not get fixed.
The report puts 85 per cent of maintenance in the reactive bucket — wait for it to break, then dispatch — despite its own finding that planned maintenance is both more effective and more cost-efficient.
And the chain is long. A tenant rings a call centre or finds a local housing officer. The request is recorded. A work order goes to a head contractor. The head contractor arranges a subcontractor. The subcontractor travels. In a region the size of the Kimberley, that travel is the expensive part, and it is charged whether or not the repair actually holds.
KCLS chief executive Matt Panayi named the problem precisely:
"The current model is expensive and dysfunctional, that's reflected in the title of our report: Broken by Design."
"All the evidence points to it being systemic problems that arises from how the model itself operates rather than small independent points where things are going wrong."
He also flagged the compounding failure: completed maintenance often fails to address the underlying issue, which produces more delays and more cost. You do not pay for the repair once. You pay for the travel, then the wrong repair, then the travel again.
That is the injustice. Not that money wasn't spent — a quarter of a billion dollars was spent. It's that the people with the least capacity to absorb a broken house absorbed one anyway, while the spending went to the logistics of a model the report says was broken by design. The WA government is now reviewing its maintenance arrangements, including the practice of awarding long-term contracts for repairs, and the Housing Minister has agreed to meet the service that wrote the report.
What this means if you own property
This is a public housing story, and the people in it deserve better than a property lesson bolted onto their situation. But there is a structural point in it that applies to every asset in this country, and it is one most investors learn expensively.
The condition of a building is a cash flow, not a footnote.
A property does not fail on the day the shower collapses. It fails across the years when maintenance is reactive instead of planned, when the cost of getting a qualified trade to the door is higher than anyone modelled, and when the work that does get done treats the symptom. Reactive maintenance on a structurally tired asset is the single most reliable way to turn a yield on paper into a loss in the bank.
Headline yield never shows you this. A suburb median never shows you this. A rental estimate on a listing page never shows you this.
The Ripehouse proof point
This is exactly what street-level data is for.
At Ripehouse we do not assess a property against its suburb. We assess it against its street. On any given street we can see the achieved rent versus the advertised rent — the gap between the two is usually the first sign that the stock is tired and tenants are negotiating. We can see street-level vacancy, and days on market for that street's specific stock type, which tells you how long a place like this actually sits when something goes wrong with it. We can see approved-but-unbuilt competing supply, which tells you what your tenant's alternatives will be in three years. And we can see buyer depth on exit — how many buyers are genuinely active on that street, not that postcode.
Our R-Score and street heatmaps exist because two homes eight hundred metres apart can have completely different maintenance profiles, completely different tenant demand, and completely different exit depth. The median averages that away. Street data does not.
An investor who buys the median buys the average of a good street and a bad one. An investor who buys the street knows which one they're getting.
The reframe
The lesson of a $250 million maintenance bill that leaves seven in ten homes waiting is not that property is a bad asset class. It is that the model you buy into determines what your money does.
Property remains one of the most reliable wealth-building assets available in Australia — but only when the asset, the street and the data are right. Get those three right and maintenance is a line item. Get them wrong and maintenance is the whole story.
Headlines tell you what happened. Street-level data tells you whether it is about to happen to you.
Ripehouse Advisory helps investors choose the street before they choose the house. If you want to know what your shortlist actually looks like at street level — achieved rent, vacancy, days on market, competing supply and exit depth — that is the work we do.
For investors facing the same risk of reactive maintenance and hidden stock quality, the Ripehouse Advisory webinar is a practical way to test whether a street’s rent, vacancy and exit depth will support the holding costs before you buy.
Frequently asked questions
Why are so many public housing tenants in WA’s Kimberley still waiting for urgent repairs?
The report says the maintenance model is expensive and dysfunctional, with most work handled reactively through a long chain of call centre, housing officer, head contractor and subcontractor. It also says completed maintenance often does not fix the underlying issue, which creates more delays and repeat costs.
What was the $250 million spent on in the Kimberley housing system?
According to the report, about $250 million has been spent on travel and overhead costs associated with housing maintenance since 2019. It was not spent on the repairs themselves, which is why many homes still have urgent issues.
What did the report find about the condition of public housing homes in the Kimberley?
The Kimberley Community Legal Service surveyed 166 public housing tenants across 22 communities and found that more than 95 per cent did not consider their homes safe or in good condition. Almost seven in ten were waiting on urgent repairs.
What is the main lesson for property owners and investors?
The article says the condition of a building is a cash flow issue, not a footnote. Reactive maintenance on a structurally tired asset can turn a yield on paper into a loss in the bank.
Why does the article say street-level data matters more than suburb averages?
It argues that two homes close together can have very different maintenance profiles, tenant demand and exit depth. Street-level data can show achieved rent, vacancy, days on market, competing supply and buyer depth, while a suburb median can hide those differences.
General information only. It does not take your objectives, financial situation or needs into account, and nothing here is legal, financial, taxation or investment advice specific to your circumstances.