Strategy · 26 July 2026 · 4 min read
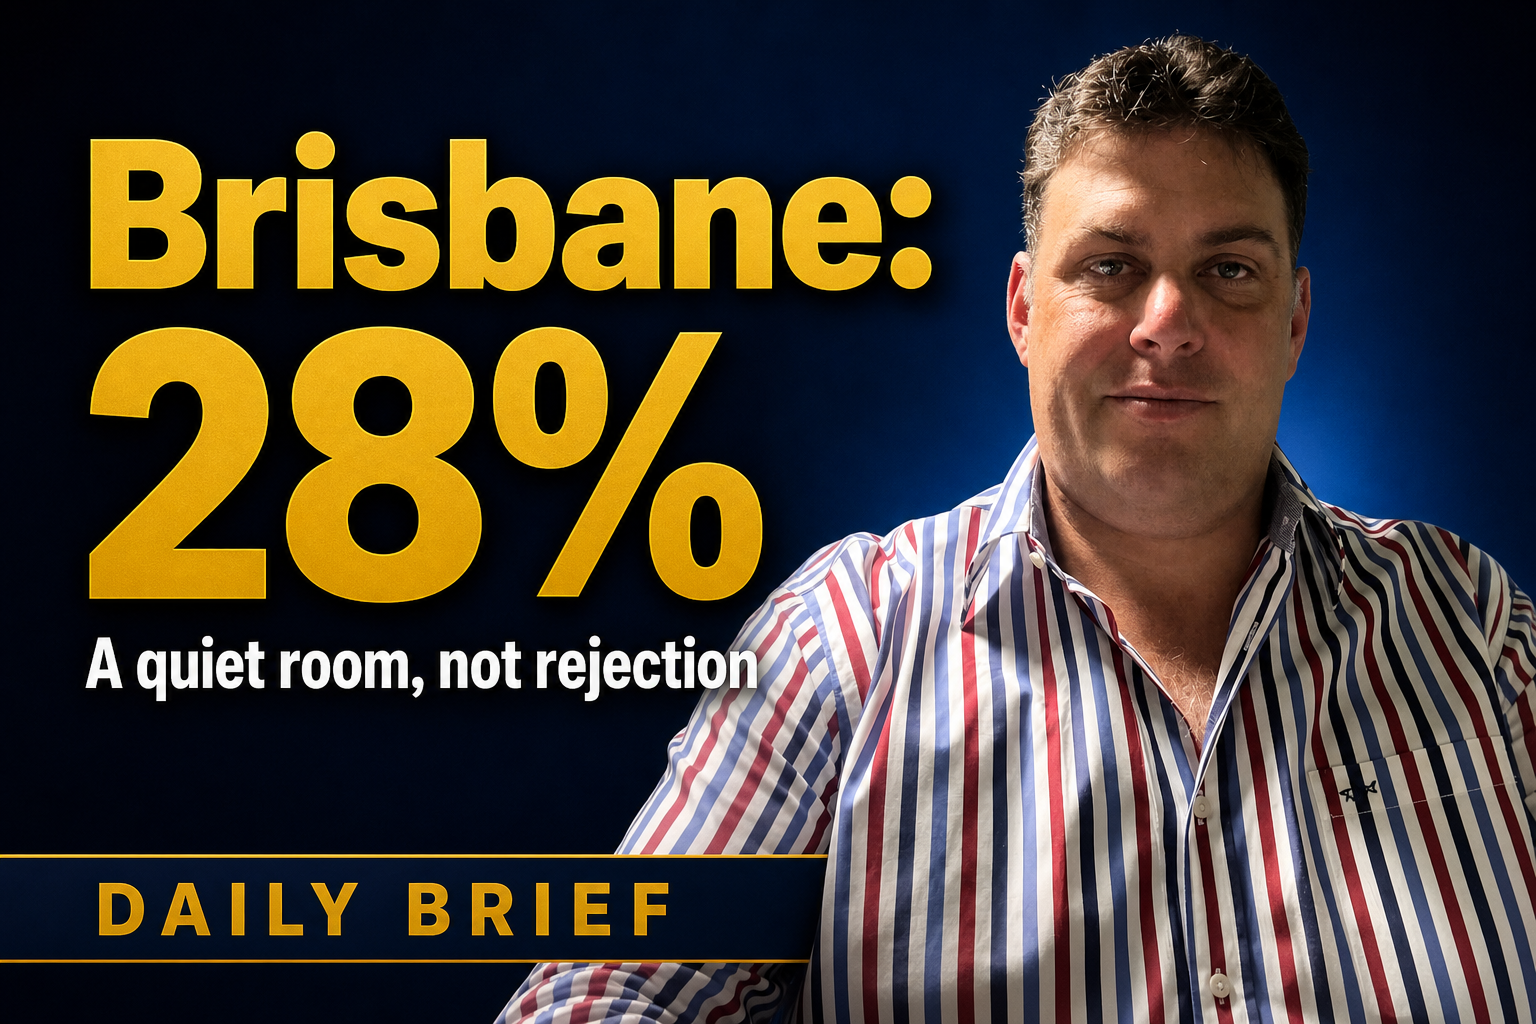
Investor mortgage applications are down 35%: what it means now
Investor mortgage applications are down 35% since February, but the real story is a thinner, more selective market. Ripehouse Advisory unpacks what that means for pricing, yield and where the opportunities remain.
▶ Watch the full video on YouTube: 35% Investor Pullback Is Changing the Market
Investor mortgage applications are down 35% since February, and that matters far more than sentiment surveys or headlines. The real story is not that property demand has vanished — it is that the market has become more selective, and that changes where the opportunities sit.
Nationally, the averages are softening. But the evidence in the transcript points to a market where quality assets are still attracting strong competition, while weaker stock is being ignored. For investors, that is not a reason to step back. It is a reason to be more precise.
Investor mortgage applications are down 35% — and buyers are changing
The key number here is not sentiment, but action. Investor mortgage applications are down 35% since February.
For context:
- Homebuyer applications are down 19%
- Upgrader applications are down 15%
So investors are pulling back more than twice as fast as the other buyer groups mentioned. That does not mean the market has stopped. It means the pool of buyers is thinner, more qualified, and more selective.
That distinction matters. When fewer buyers are chasing the same stock, the average price can fall even while good properties still draw competition.
The national market is softer, but not uniform
The transcript paints a clear national split.
- Cash rate: 4.35%
- Next Reserve Bank decision: 10th and 11th of August
- Inflation in May: 4%
- Trimmed mean: 3.6%
- National home values in June: -0.4%
- Sydney: -1.2%
- Melbourne: -1%
- Brisbane: +0.3%
- Perth: +0.7%
- Adelaide: flat
- Regional Australia: +0.3% in June and +1.1% across the quarter
The other important backdrop is stock and activity:
- Capital city sales volumes: -16.2% year on year
- Listings: +11%
More stock, fewer buyers. That is the arithmetic behind the softer national average.
A falling average can still hide strong auction results
The Sydney example in the transcript is the best reminder that averages and individual results are not the same thing.
Three properties sold well in one headline-stacked auction story:
- Carlton: sold for $2,040,000; 7 registered bidders, 5 active
- Ryde: sold for $3.8 million; 8 registered bidders, 5 active
- West Ryde: sold for $1,705,000; 6 registered bidders, 4 active
Every single one sold at or above reserve, with two above reserve. That is happening in a market that is supposedly dropping.
The takeaway is simple: a soft market does not mean every asset is weak. It means pricing discipline matters more, and quality stock still clears when it is correctly positioned.
Why our R-Score data still points to tight markets
While Sydney is cooling, the transcript highlighted two Queensland markets that are operating on completely different fundamentals.
Maryborough, Fraser Coast
- Ranked 3rd in the country on R-Score
- 97th percentile
- Population: 15,400
- Median sold price: $615,000
- Yield signal: 6.73%
- Vacancy: 0.81%
- Supply added over the last year: 0
- Supply added in six months: 11 properties
The long-term trend is what matters. Eight quarters ago, the average sold price in Maryborough was $440,000. Last quarter it was $622,000, a rise of 41% on steady quarterly sales volume between 57 and 86.
Bentley Park, Southern Cairns Corridor
- Ranked 2nd in the country on R-Score
- 99th percentile
- Population: 8,000
- Growth over three years: 4.47%
- Median sold price: $769,000
- Yield signal: 5.84%
- Vacancy: 0.56%
- Supply added in six months: 2 properties
Bentley Park’s prices rose 33% over the same eight quarters while quarterly sales volume fell from 58 to 26. That is rising prices with disappearing stock.
Why street-level research matters in Maryborough
This is where suburb averages stop being enough.
Ripehouse Advisory mapped 9,930 address points, 47 census blocks and 550 sales with coordinates in Maryborough. The spread inside one suburb was stark:
- Gregory Court: around $775,000
- King Street: around $321,000
- A 2.4x price difference across the same suburb
Rental yield told a similar story:
- Draeger Street: roughly 7.8% gross
- Campbell Street: roughly 3.0% gross
- Suburb average: 6.73%
Ownership profiles also varied sharply:
- Aldridge Street: about 83% owner occupiers
- Adelaide Street: about 35% owner occupiers
And social/public housing concentration ranged from:
- Ambrose White Street: about 35%
- Aberdeen Avenue: 0%
That is why suburb-level research is useful for orientation, but not enough for buying. The suburb tells you where to look. It does not tell you what to buy.
What investors should take from the 35% pullback
The right question is not whether investors should leave the market because applications are down 35%. The right question is what kind of market this creates for disciplined buyers.
The answer in the transcript is clear:
- competition is thinner
- pricing is more rational
- income is stronger than it has been in the past
National rents are up 40.6% over five years, and the gross yield has moved from about 3.5% to 3.7% because prices softened while rents did not.
That does not make every purchase a good one. It makes research more important, not less. In a quieter market, the danger is not simply buying — it is buying the wrong asset without enough data.
The Ripehouse Advisory take
A 35% drop in investor applications does not mean property is broken. It means the market is less forgiving, which is exactly when data-led advice adds the most value.
At Ripehouse Advisory, we read beyond the headline: vacancy, supply, yield, sales volume, ownership mix and street-level variation. That is how you separate a genuinely strong asset from a suburb average that looks fine on paper but performs very differently in practice.
With investor demand thinner and stock more selective, the question is which suburbs still offer genuine yield and shortage signals, so the Ripehouse Advisory webinar can help you test those assumptions against the data before buying into a market that now rewards precision over broad trends.
Frequently asked questions
Why does a 35% fall in investor mortgage applications matter for the Australian property market?
It means the market is thinner and more selective, not that demand has disappeared. Fewer investors are chasing the same stock, so quality properties can still attract competition while weaker stock is more easily ignored.
What should investors take from national prices and listings being softer at the same time?
The article says the national average is being pushed down by more stock and fewer buyers. That makes pricing more rational, but it also means investors need to be more precise about what they buy.
How can a market be falling overall if some properties are still selling strongly?
A softer market can still produce strong results for well-positioned properties. The Sydney examples sold at or above reserve, showing that quality stock can clear well even when the headline market is down.
Which Australian areas in the article still look tight for investors?
Maryborough in Queensland and Bentley Park in the Southern Cairns Corridor both show tight conditions, with low vacancy and very limited new supply added. The article says those markets are operating on different fundamentals to the softer capital-city averages.
Why is suburb-level research not enough when looking at places like Maryborough?
Because the article shows big differences within the same suburb in price, yield, ownership mix and public housing concentration. Suburb averages help you orient yourself, but street-level data is needed to identify the right asset.
General information only. It does not take your objectives, financial situation or needs into account, and nothing here is legal, financial, taxation or investment advice specific to your circumstances.