News · 11 October 2026 · 4 min read
His repayments are up $1,800 a month. Everyone says wait for rates to fall. Nobody says what waiting costs.
He is 41 and his home loan takes about $1,800 a month more than it did in 2022. He lives in Adelaide's inner south, has the kids every second week, and has roughly $200,000 of usable equity in a house he has owned for nine years.
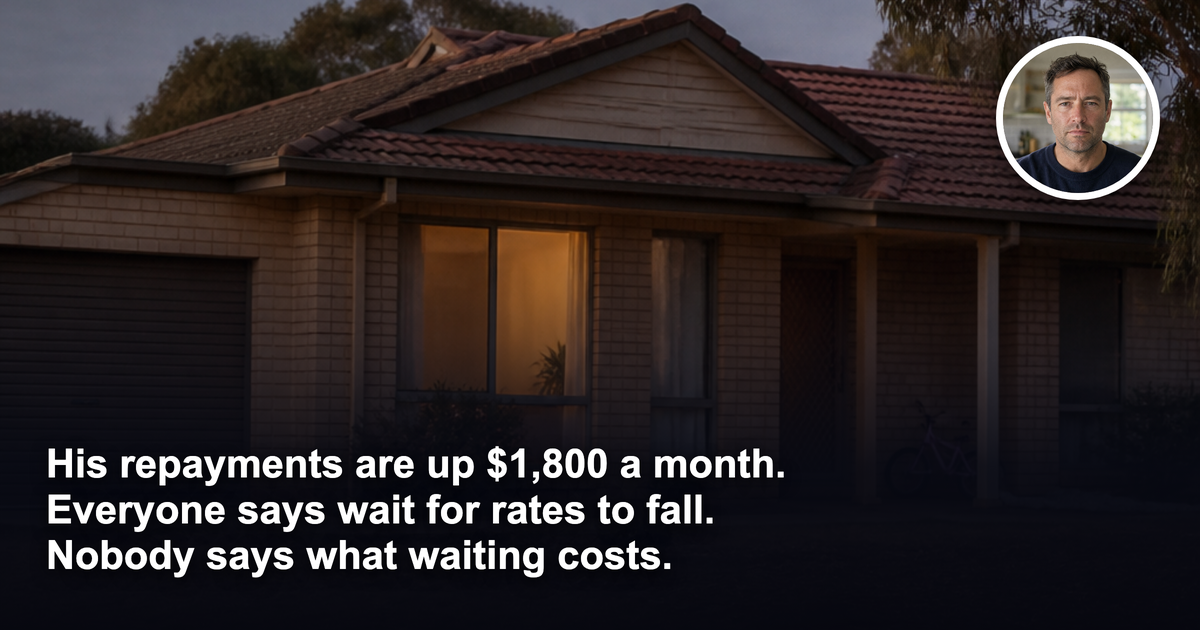
He is 41 and his home loan takes about $1,800 a month more than it did in 2022. He lives in Adelaide's inner south, has the kids every second week, and has roughly $200,000 of usable equity in a house he has owned for nine years.
He is a composite illustration, not a real person. The position he is in is common, and so is the headline that landed on his phone this weekend. The Australian Financial Review reported on 11 October that after a relentless run of rate rises, mortgage repayments as a share of household income are back at levels last seen in 1989.
He read it twice. Then he did what most people do with a number like that. He shelved the plan.
The plan he shelved
Twelve months ago the idea was simple. Use some of the equity, buy one investment property, hold it for fifteen years, and have something to show for a good income beyond a paid-off house.
His income is strong. His net worth has not kept pace with it, and he knows it.
Then the repayments climbed. The offset balance thinned. And every person he spoke to said the same sensible-sounding thing. Wait. Rates will come down. Buy then.
The question
"My repayments are up $1,800 a month and the paper says the burden is the worst it has been since 1989. I have the equity. Do I just wait for rates to fall before I do anything?"
The answer: the headline is about the average household
The AFR figure is real and it matters. It describes the share of income that Australian households, taken together, are handing to their lender. It is a measure of strain across the whole country.
It says nothing about him.
It says nothing about his cash buffer, his loan structure, the rent a particular street would pay, or whether a second loan would be set up so the family home never stands behind the investment. Those are the things that decide whether an investment property puts a household at risk. A national ratio decides none of them.
That is the expensive mistake. He is treating a statistic about everyone as a verdict about himself, and then reaching for a forecast to deal with it.
"Wait for rates to fall" is a forecast. Nobody knows when, or by how much. The AFR did not say, and we will not either.
A forecast dressed up as caution is still a forecast.
What waiting costs
A fifteen-year hold started at 41 finishes at 56. Started at 44, it finishes at 59. He does not get those years back, and compounding does not refund them.
The holding cost of a property is one line in the sums, and everyone can see it. The cost of owning nothing for three more years is invisible, so nobody adds it up.
Here is where we take a position.
If his buffers, tested at current rates, cannot carry both loans through a bad year, he should not buy. Full stop. The 1989 comparison is irrelevant at that point because his own numbers already answered the question.
If his buffers can carry it, the 1989 comparison is also irrelevant. The question was never whether the country is stretched. The question was whether his structure is sound.
Either way, the headline does not get a vote.
Structure before suburb
The households that come through a stress period intact tend to share the same boring features.
- The investment loan stands alone, secured against the investment, with the family home kept out of it.
- Serviceability is tested at current rates plus a margin, with a cash buffer that survives a vacancy and a repair in the same year.
- The order of purchases is planned so the first asset does not use up the borrowing capacity needed for the second.
- The asset is chosen on the street, with the suburb name a long way down the list.
That last point is the one most people skip. Two streets in the same suburb can be having completely different outcomes on rent, days on market and vacancy. A suburb median tells you about as much about a specific house as the AFR ratio tells you about a specific household.
The Ripehouse reframe
Our clients bought through the rate rises. Across 997 client portfolios since 2021, the median portfolio has grown 19.0 per cent a year on a 5-year rolling basis, against about 4.3 per cent nationally (benchmark: CoreLogic/Cotality). We publish the full distribution, including the portfolios that underperformed. Past performance is not a guarantee of future results.
That result did not come from picking the moment rates turned. It came from structure and street selection done before the contract was signed, so the household could keep holding when the headlines got loud.
He has not lost anything by reading the AFR this weekend. He will lose something if he lets it make the decision for him.
Want to see how we test a decision like this at current rates, street by street? Join Jacob's free live webinar.
General information only. It does not take your objectives, financial situation or needs into account, and nothing here is legal, financial, taxation or investment advice specific to your circumstances.