News · 11 October 2026 · 4 min read
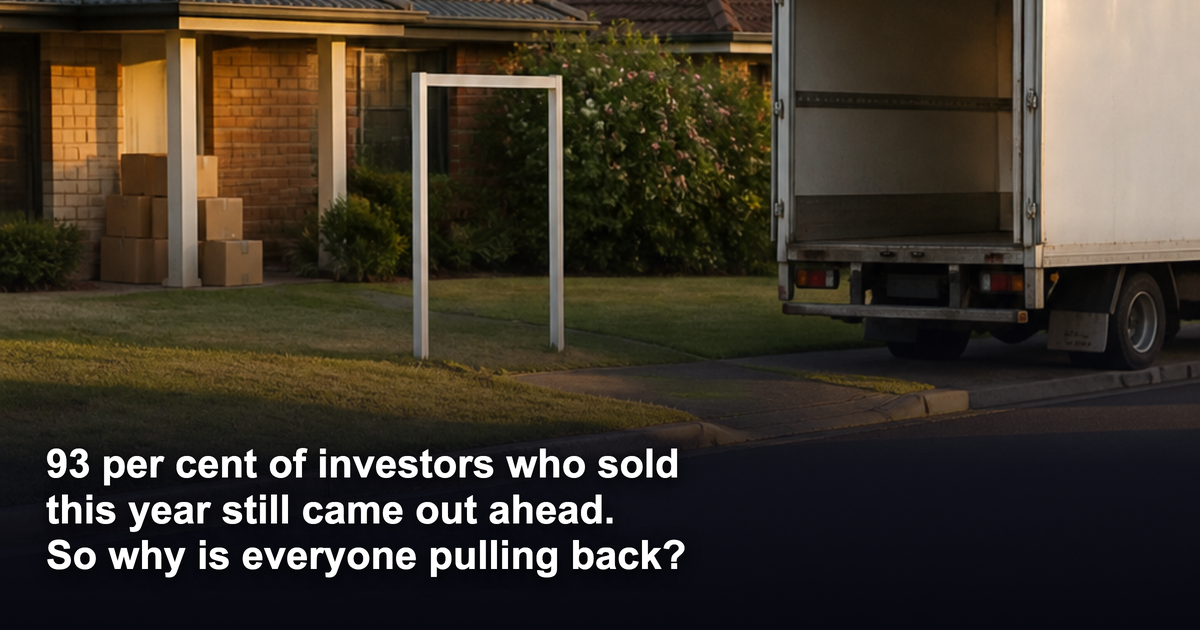
93 per cent of investors who sold this year came out ahead. So why is everyone pulling back?
A report published on 11 October, covered by realestate.com.au, found that investors are pulling back sharply after rate hikes and tax changes.
The number nobody led with
A report published on 11 October, covered by realestate.com.au, found that investors are pulling back sharply after rate hikes and tax changes.
That was the headline. The figure that mattered sat further down.
93 per cent of investors who sold this year still came out ahead.
Read that next to the word "pullback". Investors are leaving the market, and more than nine in ten of them are leaving with a profit.
What changed
Two things pushed investors toward the exit, according to the report. Rates went up, so holding costs went up with them. Tax rules changed, so the sums that made a property worth holding stopped adding up for some owners.
Both are stories about cash flow getting tighter. Neither is a story about property failing. An owner who was comfortable at one repayment level becomes uncomfortable at a higher one, and if the tax position moves at the same time, they sell.
That is a rational decision for a stretched owner. It says very little about the asset.
What the 93 per cent does and does not tell you
Be careful with the figure. It covers investors who sold this year. It does not describe the people still holding. It may not account for selling costs or tax, and the report does not say how far ahead the sellers finished. Some will have cleared a large gain. Some will have scraped over the line.
What it does tell you is that the properties being sold into this pullback are, overwhelmingly, properties that went up in value while their owners held them.
The sellers are offloading assets that worked, because the structure around those assets stopped working.
That distinction is the whole article.
What it means if you have equity sitting still
If you own your home, have usable equity, and have paused since rates moved, you are on the other side of this trade.
Every seller in that 93 per cent needs a buyer. Fewer investors competing for the same stock means less pressure at the point of purchase. Thin buffers and an unpriced tax change are doing the pushing, and the property itself had little to do with it.
A buyer with a buffer and a long holding period is in a very different position.
None of that proves this is the moment to buy. Nobody can tell you prices have bottomed, and this article will not try. What it does show is that the reason you paused is being misread. You paused because the headline said investors were leaving. The data says most of them are leaving ahead.
The decision, and the trade-offs
A reader with equity now has three options, and "wait for certainty" is one of them. Each has a cost.
Keep waiting. The cost is time. Equity sitting in your home earns nothing on its own, and certainty, when it arrives, arrives for everyone at once, with all the competition that brings.
Buy the way the sellers bought. Thin buffer, short horizon, numbers that only work at one rate. The report has already told you how that ends. The asset may do fine. The owner sells before it has the chance.
Buy with the structure the sellers lacked. A cash-flow buffer that survives another rate move. A holding period measured in years, so a tax change becomes an adjustment rather than an exit. An asset chosen on data rather than a brochure.
The third option is harder. It is also the only one that converts the 93 per cent from a headline into a plan.
The street, not the market
Here is where the report's figure runs out. "93 per cent came out ahead" is a national average over every sale in the country. It flattens the spread.
Two streets in the same suburb can be having completely different years. One is holding rents and clearing stock in weeks. The other has listings sitting for months and vacancy creeping up. A suburb median hides both.
The sellers who finished behind were in the wrong street, or bought the wrong asset for that street, or bought with no buffer and had to sell into a soft month. The national market was fine. Their corner of it was not.
That is why we test a purchase at street level, on days on market, vacancy and the shape of the local rental pool, before the asset is chosen. The market average tells you investors are mostly fine. The street tells you whether you will be.
What we publish
Ripehouse clients have seen median portfolio growth of +19.0 per cent per year on a five-year rolling basis, against about 4.3 per cent nationally (CoreLogic/Cotality), across 997 client portfolios since 2021. We publish the full spread, including the portfolios that underperformed. Past performance is not a guarantee of future results.
The point of publishing the whole distribution is the same point the report makes by accident. The average hides the losers. Knowing where the losers were is what keeps you out of them.
The reframe
Investors are pulling back because their structure failed them, and most are still walking away ahead.
If you have equity and have paused, the question is whether your holding period, asset selection and buffer would hold up in the conditions now pushing others out. Structure, not timing.
Want to see how we test that street by street? Join Jacob's free live webinar.
General information only. It does not take your objectives, financial situation or needs into account, and nothing here is legal, financial, taxation or investment advice specific to your circumstances.