News · 10 October 2026 · 4 min read
Corio is up $70,000 for the year. He bought in March. Why is he the one going backwards?
He is 46 and $580,000 into a three-bedroom house in Corio that he has stood in exactly once.
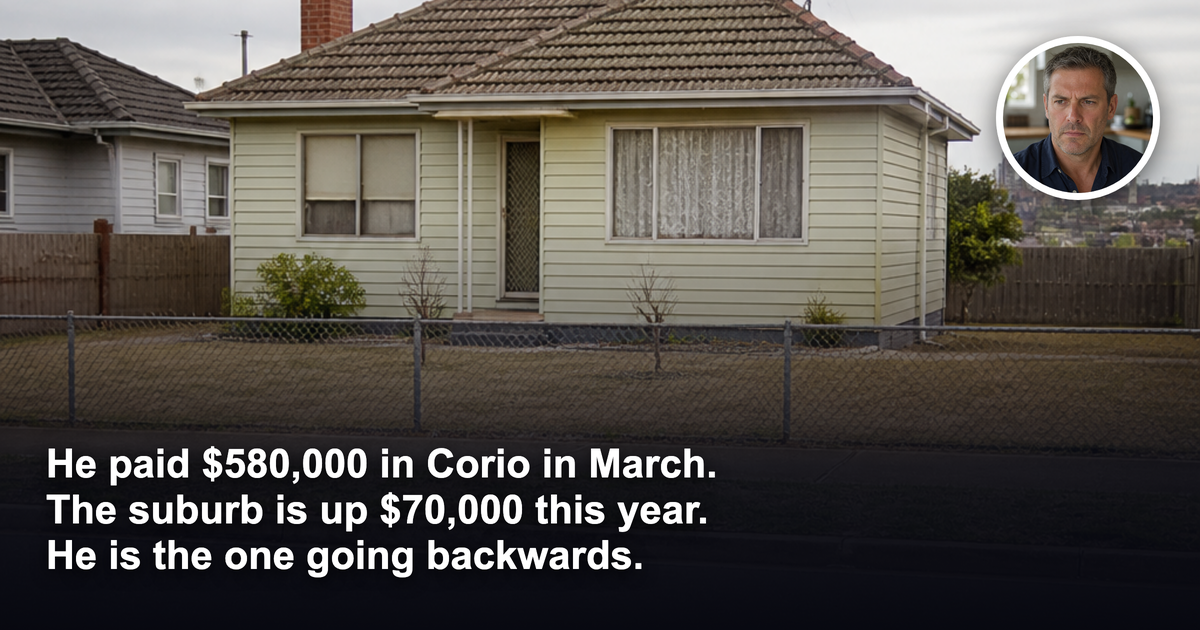
He is 46 and $580,000 into a three-bedroom house in Corio that he has stood in exactly once.
He bought it in March. He had read, more than once, that the cheaper end of Geelong was where the growth was. Corio, Norlane, St Albans Park, Whittington. Rising stars. Sub-$600,000 houses, a decent yield, and a buyers' agent on the phone saying the window was closing.
He is a composite illustration, not a real person. The numbers around him are real, and they came out on Thursday.
The question
"PropTrack says Corio is up 14 per cent for the year. More than $70,000. I bought in March and my broker just told me the place would probably value under what I paid. How is the suburb up and I'm down?"
The answer: the year's gain was never his
The 12-month figure and the three-month figure describe two different owners.
PropTrack's new quarterly suburb data, published by realestate.com.au on 9 October, puts the median house value in Corio at $579,160. Over 12 months that is up 14 per cent, or $70,632. Over the past three months it is down 2 per cent, or $12,626.
Read those two numbers together and the story is simple. Most of the year's growth had already happened by the time he signed. Whoever sold to him in March banked the rising-star run. He bought the top of it, and then the quarter turned.
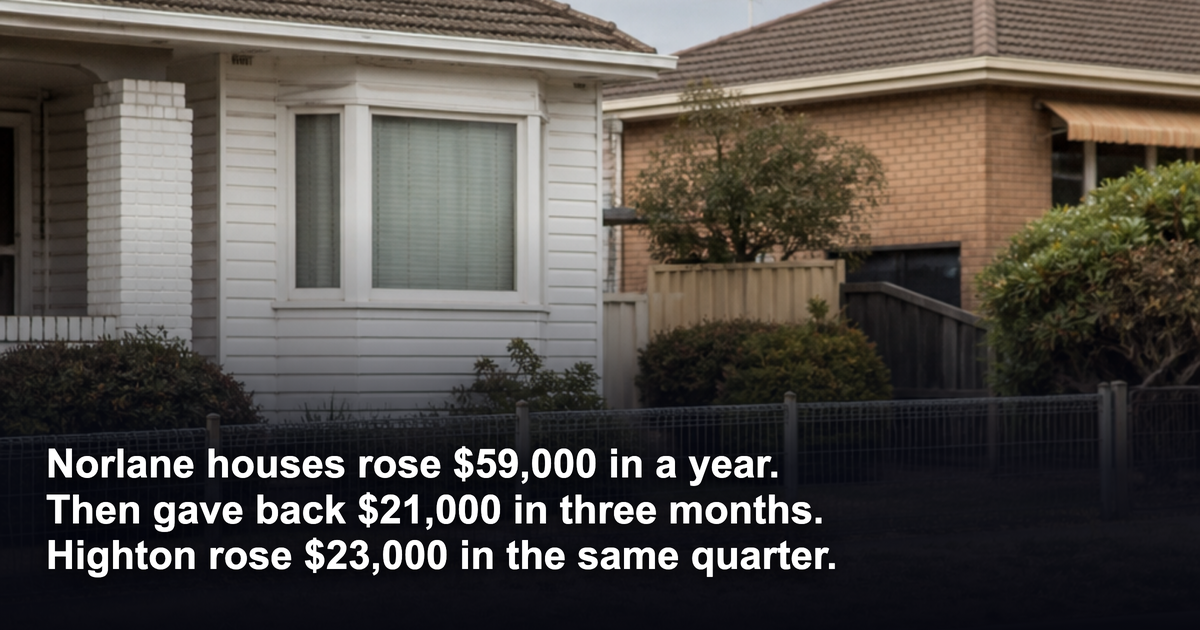
Norlane is the same shape, sharper. Up 13 per cent for the year, $59,222. Down 4 per cent in the quarter, $21,790. St Albans Park and Whittington posted annual growth of between 10 and 14 per cent, and both contracted over the past three months.
A 14 per cent annual figure says nothing about what a house is worth today against what you paid in autumn. It says what it was worth against last October. He was not there last October.
Why these suburbs, and not the others
The report is direct about the mechanism. It notes the Reserve Bank has lifted rates four times this year, and the local agent it quotes, Maxwell Collins director Nick Lord, describes the sub-$700,000 bracket as "typically the investment profile which covers those suburbs". Investor demand surged into them, then reduced borrowing capacity took it out again in the last quarter.
A buyers' agent quoted in the same piece puts it more bluntly: interstate agents buying sight-unseen and "paying overs" pushed prices up, and those buyers have now gone.
That is the part nobody prints above the suburb name. A suburb whose growth is carried by investors is only as strong as investors' borrowing capacity. Lift rates four times and the floor moves.
The same quarter, ten minutes down the road
Now hold this next to it.
Highton, in the same city, in the same three months, rose 3 per cent. That is $23,835 on the median house. Wandana Heights rose 2 per cent, about $19,000. Grovedale, Lara, Newcomb, Newtown and Leopold were flat.
The report describes owner-occupiers moving toward family suburbs with a keen focus on particular primary school zones. Demand there comes from people who need a house to live in, inside a specific catchment. It does not evaporate when a bank tightens a serviceability calculator.
The biggest falls were at the dearer end too: Manifold Heights down 5 per cent ($46,455) and Geelong itself down 4 per cent ($34,195). So "Geelong is falling" is also wrong as a headline. Geelong is doing five different things at once, and the headline picks one.
What this means for you
If you are holding a "rising star" purchase from the past year, the three-month figure is one quarter of one suburb's median, and nothing more. He has not lost $12,600 unless he sells, and the rent he is collecting has not changed.
What the figure does tell him is who his buyers are. If the next buyer of his house is another investor with a smaller borrowing limit than the last one, his exit depends on rates. If the next buyer is a family who wants that street, it does not.
That is the question to ask before you buy into any suburb that has just been called hot: who is the demand, and what happens to them when money gets dearer?
The expensive mistake is buying the annual growth figure. By the time a suburb's 12-month number is big enough to make a headline, the people who earned it already own the houses.
The Ripehouse reframe
Momentum explains how a suburb got expensive. It says nothing about whether it stays that way.
We do not pick suburbs because they are moving. We underwrite streets on what holds demand through a rate cycle: who lives there, who wants to, how long listings take to clear and what vacancy looks like when investors step back. Two streets in the same suburb can be having completely different years, and this quarter's Geelong table is a city-wide version of that.
That is also why we publish the whole distribution of client outcomes, including the portfolios that underperformed, rather than a highlight reel. Across 997 client portfolios since 2021, the median has grown 19.0 per cent a year on a 5-year rolling basis, against about 4.3 per cent nationally (benchmark: CoreLogic/Cotality). Past performance is not a guarantee of future results, but it can be measured, and that is the point.
He will probably be fine, if he holds a house that someone wants to live in and his cash flow survives the next rate decision. Whether that is true is a street question. A suburb median cannot answer it, and it was answerable in March.
Want to see how we test a purchase like his street by street before the contract is signed? Join Jacob's free live webinar.
General information only. It does not take your objectives, financial situation or needs into account, and nothing here is legal, financial, taxation or investment advice specific to your circumstances.