News · 13 October 2026 · 4 min read
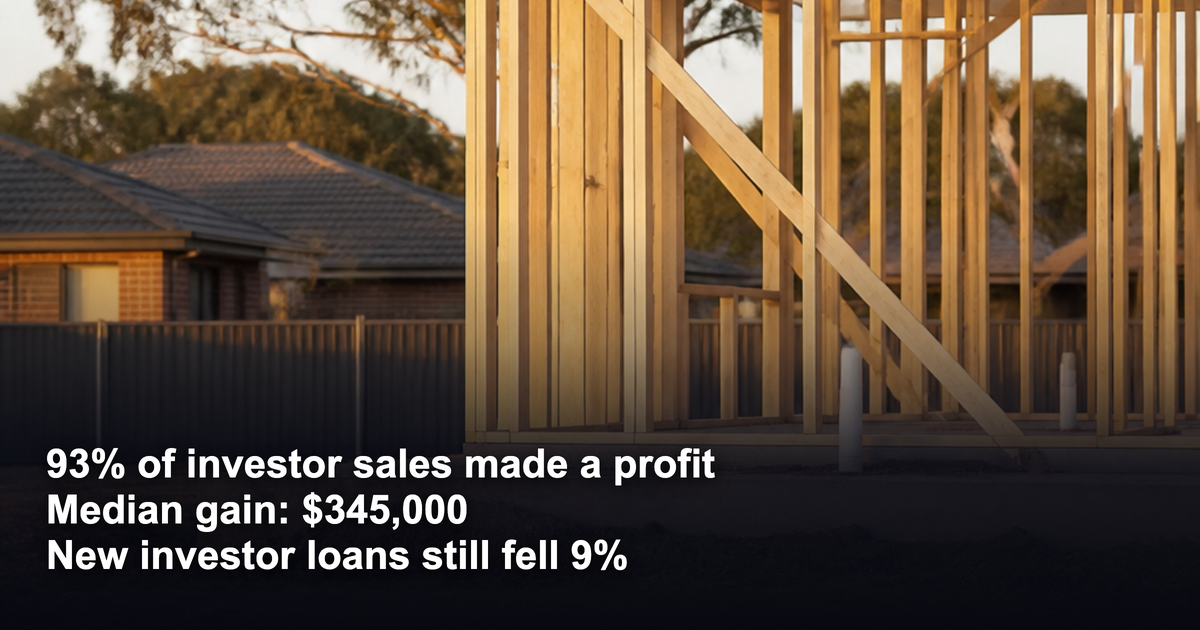
93% of investor resales turned a profit, median gain $345,000. So why did new investor loans fall 9%?
Ninety-three per cent of investors who sold a property in 2026 sold it for more than they paid. The median gain was $345,000, according to the PropTrack and Terri Scheer Investor Report released this week.
The number first
Ninety-three per cent of investors who sold a property in 2026 sold it for more than they paid. The median gain was $345,000, according to the PropTrack and Terri Scheer Investor Report released this week.
Hold that figure for a moment. It arrived in the same year as four rate rises and a Budget that changed negative gearing.
The headline most people will read says investors are "adapting". The data says something more specific.
What changed
Three things moved at once.
Rents kept climbing. Prices softened. Rental yields, the rent you collect as a share of the price you paid, rose nationally as a result.
Borrowing got dearer. Four rate rises in 2026 added to the cost of holding any property with debt against it.
The tax treatment shifted. The Budget's negative gearing changes, as the report describes them, favour newly built homes over established ones.
And the money followed. In the June quarter, new investor loans fell 9 per cent. Loans to build new homes rose 24 per cent.
Same quarter. Opposite directions.
Who it helps
Anyone holding equity, a deposit or borrowing capacity right now is looking at a different market from the one they looked at eighteen months ago.
Higher yields mean the gap between rent and repayments is narrower on a new purchase than it was. That is the gap that decides whether you can hold a property through a flat year, and whether you can hold two.
The profit history matters too. By city, the report puts the share of investor resales that made money at somewhere between 90 and 99 per cent. The distribution is wide. The floor is high.
Both figures are historical. Past performance is not a guarantee of future results. What they tell you is what the asset class has done for people who held it through rate rises, through a price correction and through a change in tax policy.
The decision
Here is the choice the report puts in front of an equity holder.
Buy established. More choice, more streets, a tenant on day one, and a resale record you can check. Lower yield than a new build in many markets, and a less favourable tax position under the new rules.
Buy or build new. Higher yield on paper, better tax treatment, and a 24 per cent jump in construction lending that tells you a lot of people have already made this call. The trade-off is concentration. New supply tends to arrive in the same corridors at the same time, and the resale record is thin by definition.
Wait. Four rate rises in a year is a reasonable excuse to sit still. It also means watching yields improve from the sidelines.
The expensive mistake sits inside the second option. Buying new because the tax treatment improved is buying for the deduction. The deduction is real. It is also identical for every new house in the estate, including the four hundred that settle after yours.
What the headline leaves out
A yield is an average. A national yield is an average of averages.
Two streets in the same suburb can be having completely different outcomes. One has had three sales in a year, all above guide, and a vacancy you could measure in days. The other has had two listings sit for four months while a new estate opened on its boundary.
The report cannot see that. A suburb median cannot see that. A tax rule certainly cannot.
The 93 per cent figure is encouraging precisely because it covers everyone who sold, good streets and bad. Our view on the 7 per cent who lost money: some were unlucky, and more of them bought the wrong asset on the wrong street, which was decided on the day they signed.
The Ripehouse reframe
Put the two loan figures together and they describe a group of people re-running their numbers and changing what they buy. That is the right instinct.
The wrong execution is to let a tax rule or a national yield figure make the choice for you.
The question that matters is the one it has always been. On this street, with this asset, does the rent cover enough of the cost to hold, and is there anything in the street's own record that says it will still be wanted in ten years?
We have built 997 client portfolios since 2021 on that question. The median portfolio has grown 19.0 per cent a year on a 5-year rolling basis, against about 6.3 per cent across the combined capitals (benchmark: CoreLogic/Cotality). Past performance is not a guarantee of future results. We publish those results, including the portfolios that underperformed.
Structure, not timing. The right asset on the right street beats the headline, whichever way the headline is pointing.
Want to see how we test this exact decision, established versus new, street by street? Join Jacob's free live webinar.
If there's a specific street you're weighing up right now, check its Street Score first — it's free, takes ten seconds, and tells you whether that street is pulling the suburb average up or riding on it.
General information only. It does not take your objectives, financial situation or needs into account, and nothing here is legal, financial, taxation or investment advice specific to your circumstances.