News · 6 August 2026 · 4 min read
Two markets are dividing — and the data shows which half is quietly running
The headlines say the market is flat. Our research database says something else: Sydney and Melbourne have stalled while the rest of the country is up 14.8% in twelve months, lower-quartile prices rose in July while the top end went backwards, and more than a third of properties now sell below their final asking price. Five charts, one conclusion.
The national headlines are written about Sydney and Melbourne. They describe a market that has stalled — and they are right, about that market. But "the Australian property market" is not one market, and the numbers most investors read each month are an average of two very different ones.
Every month we compute sold prices, rents, days on market and vendor negotiability across the country from our own research database. The July month-end data tells a consistent story: the market has split in two, and the half most investors actually buy in is quietly running.
Five charts. Claim, chart, implication — all the way through.
1. The market in the headlines is not the market you buy in
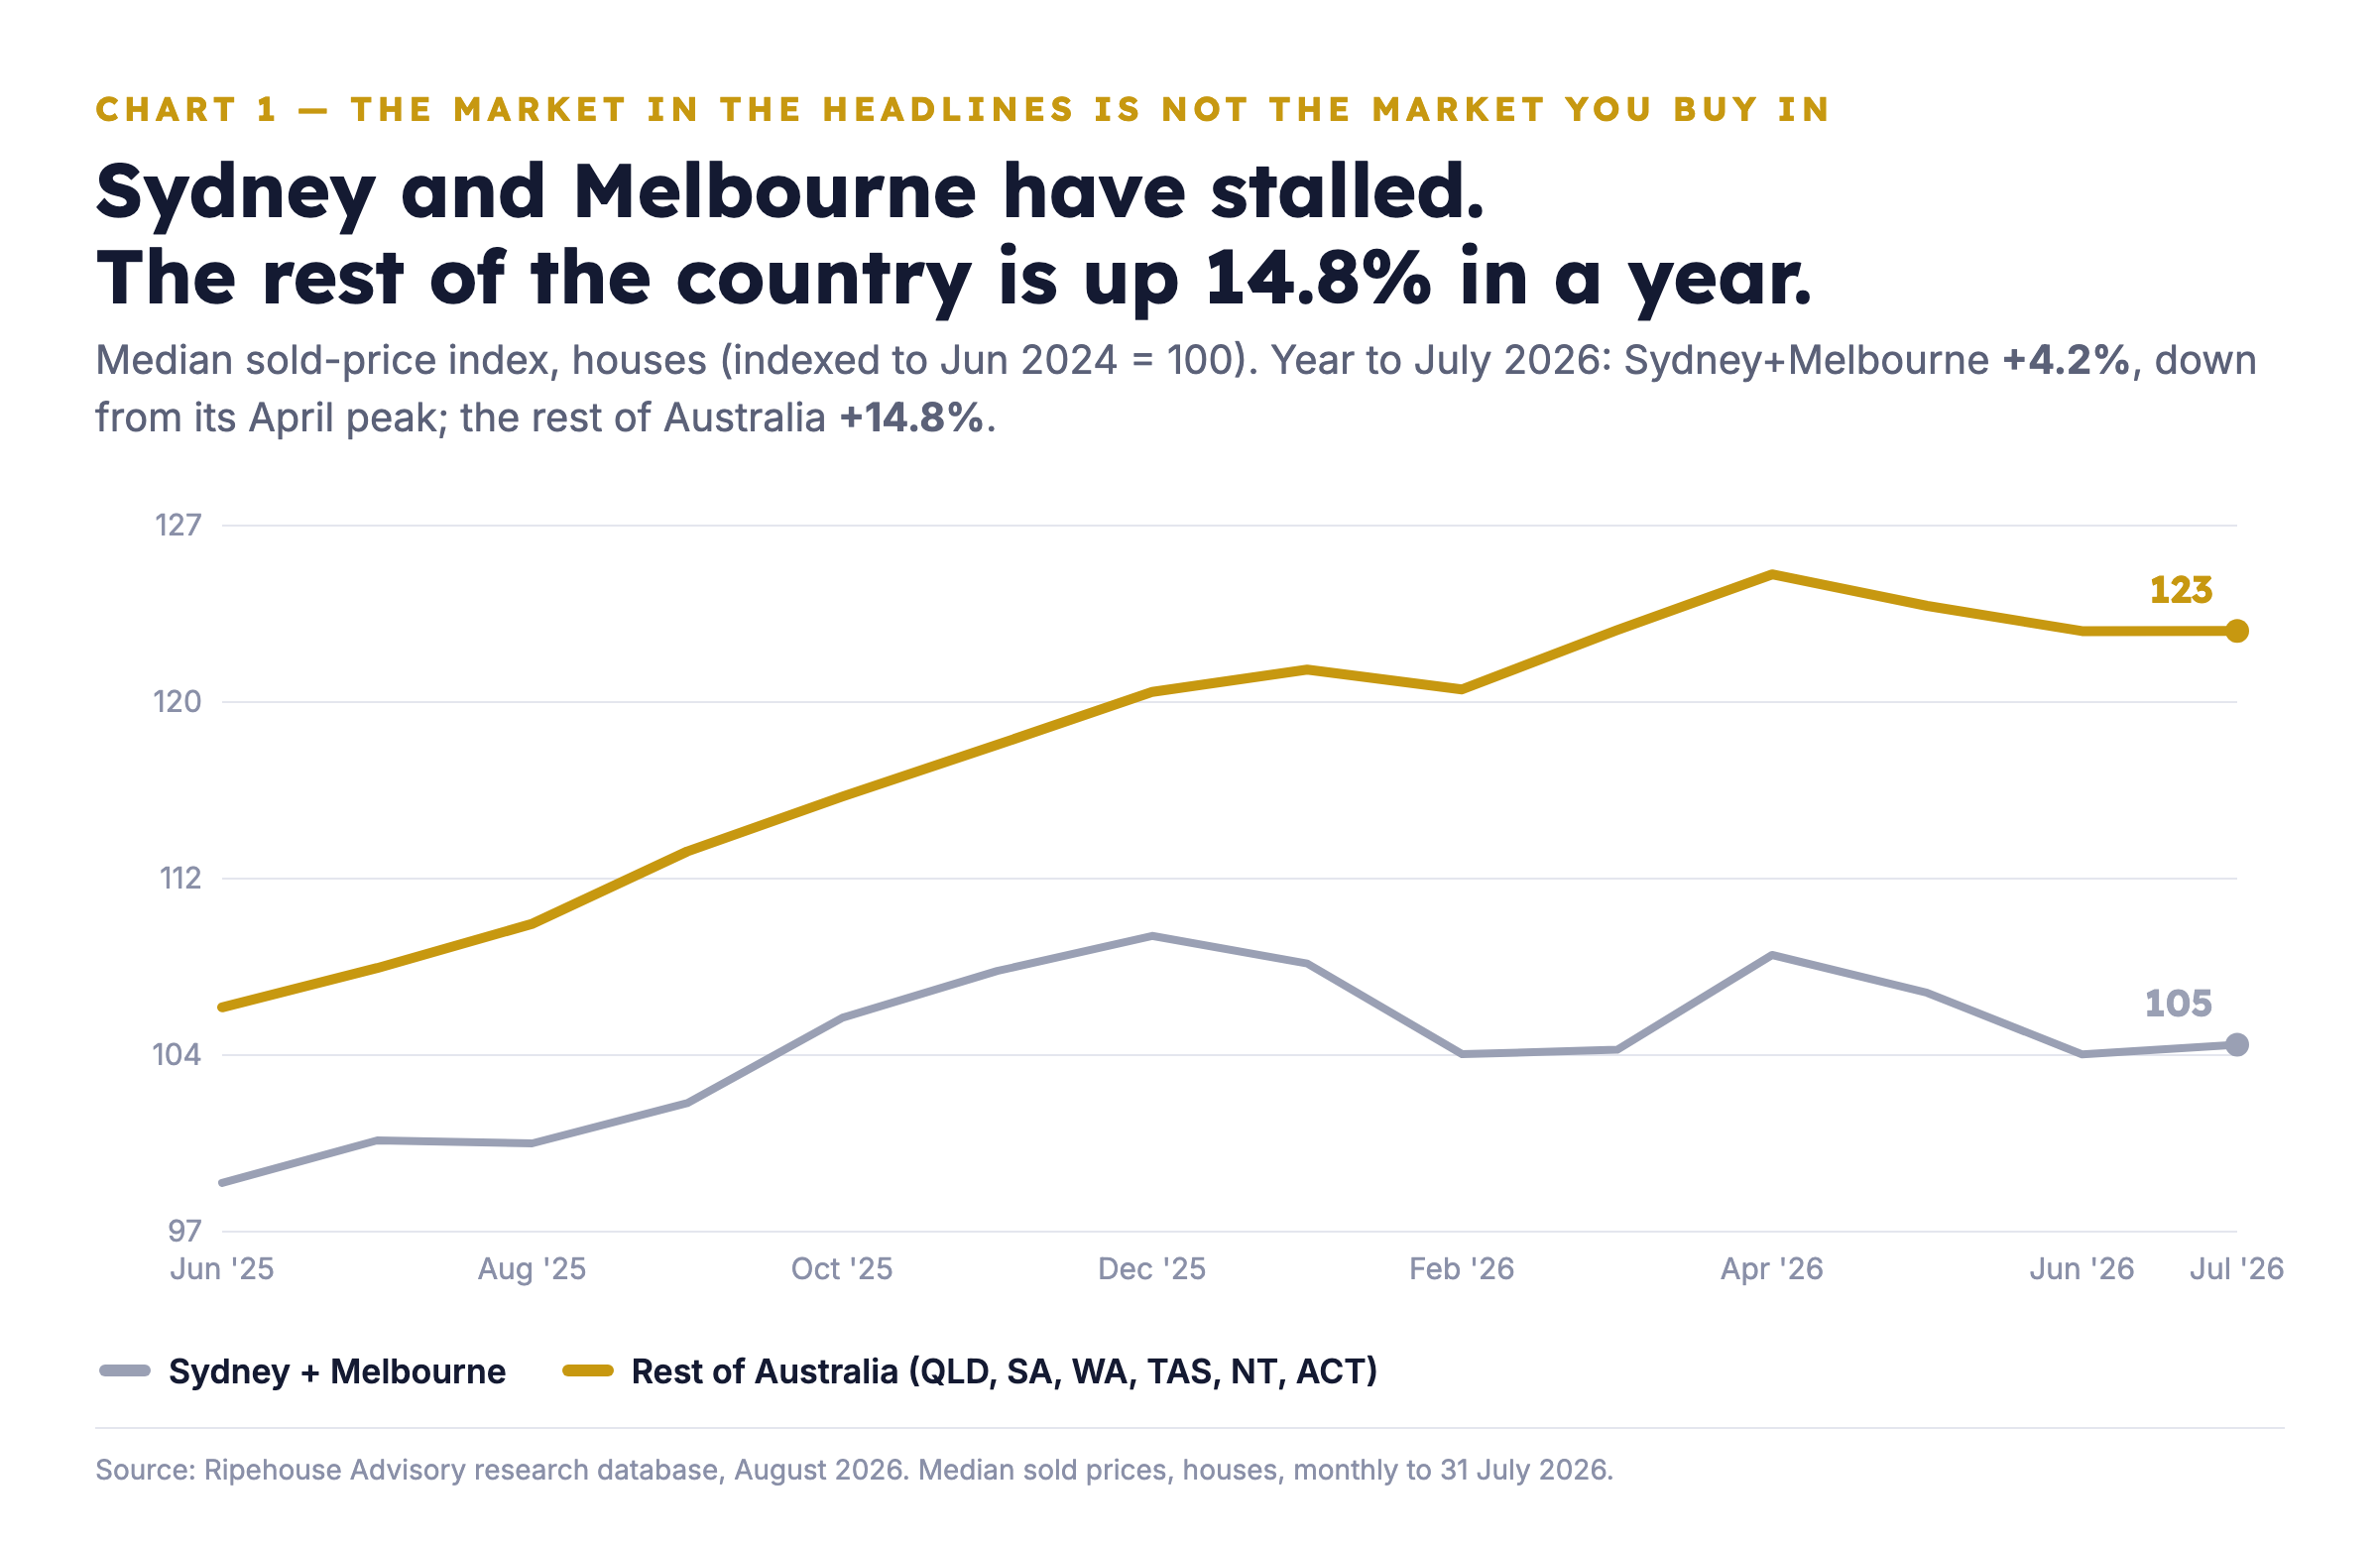
Over the twelve months to July, Sydney and Melbourne's median house price index rose 4.2% — and has fallen from its April peak. Over the same period the rest of Australia — Queensland, South Australia, Western Australia, Tasmania, the Northern Territory and the ACT — rose 14.8%.
The implication: a national average that blends those two is describing neither. If you are reading headlines about a flat market, you are reading about the two cities that happen to produce the headlines.
2. Inside the running half, it is the affordable end that is moving
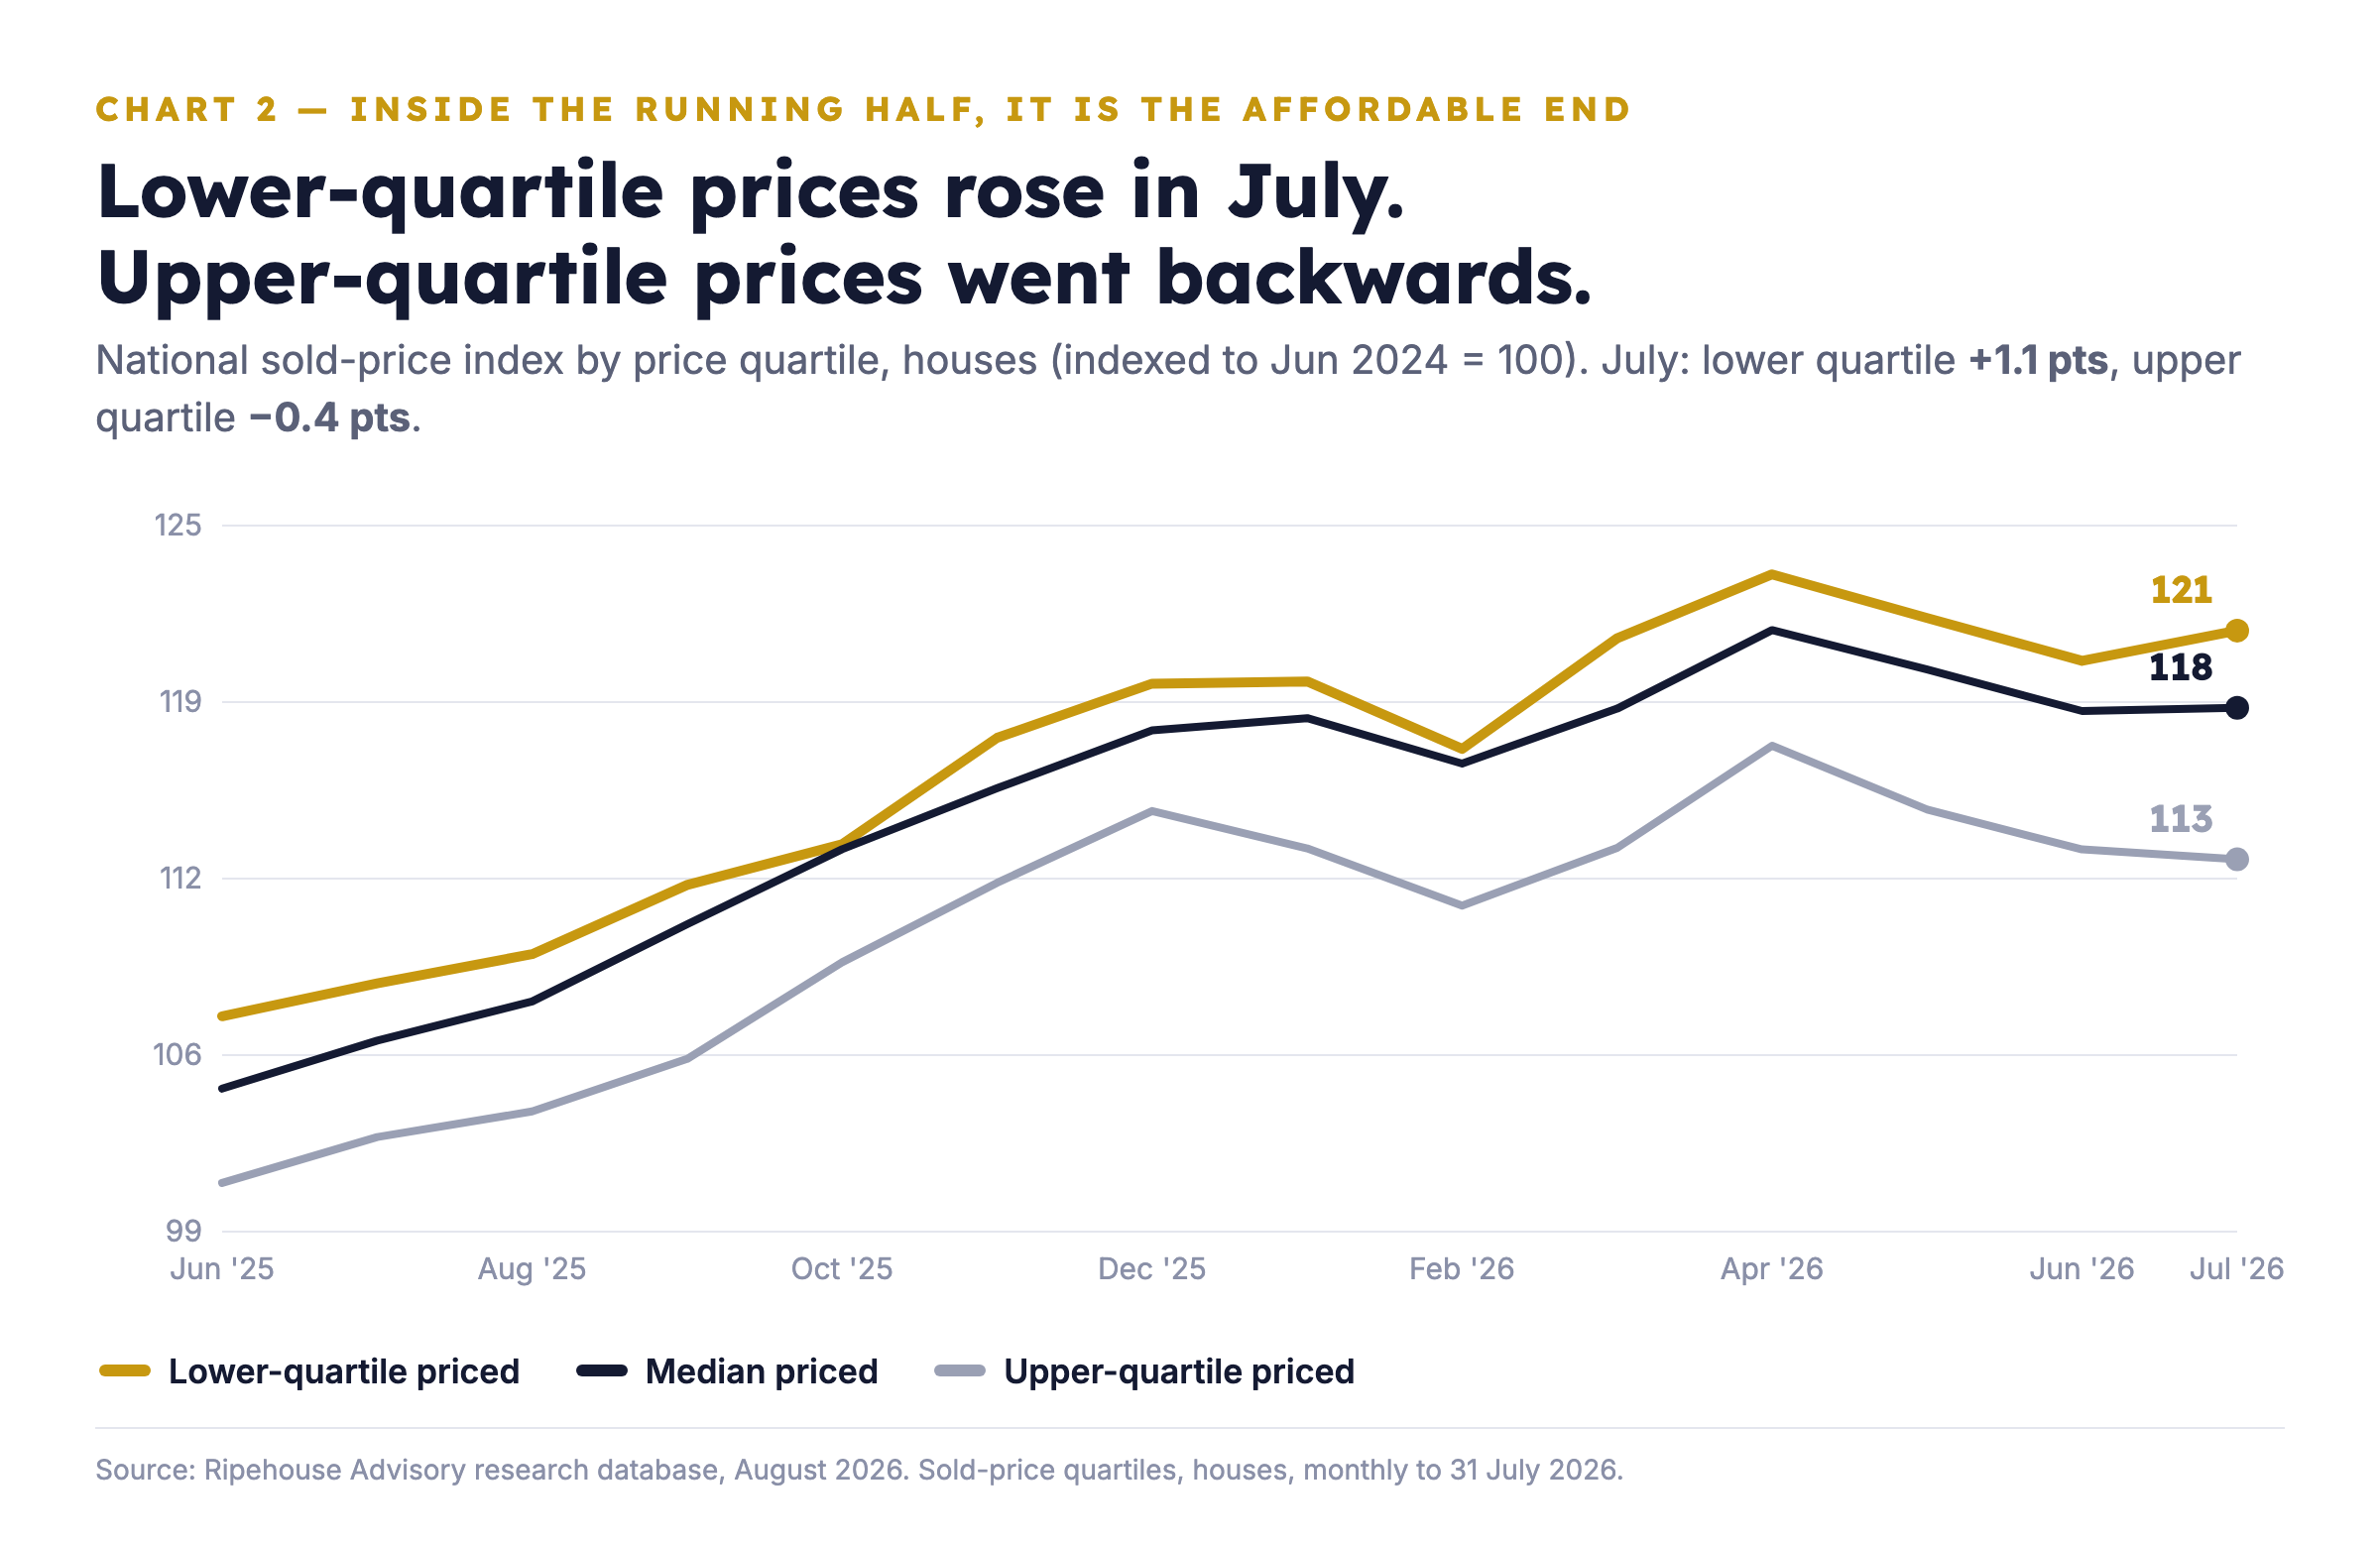
In July, lower-quartile priced houses grew in value (+1.1 index points in the month) while upper-quartile houses went backwards (−0.4). The median sat in between, essentially flat.
The implication: the split is not only geographic. Within the market, the affordable segment — the price band most investors actually transact in — is the segment with upward pressure, while the top end softens.
3. Rents confirm it is demand, not noise
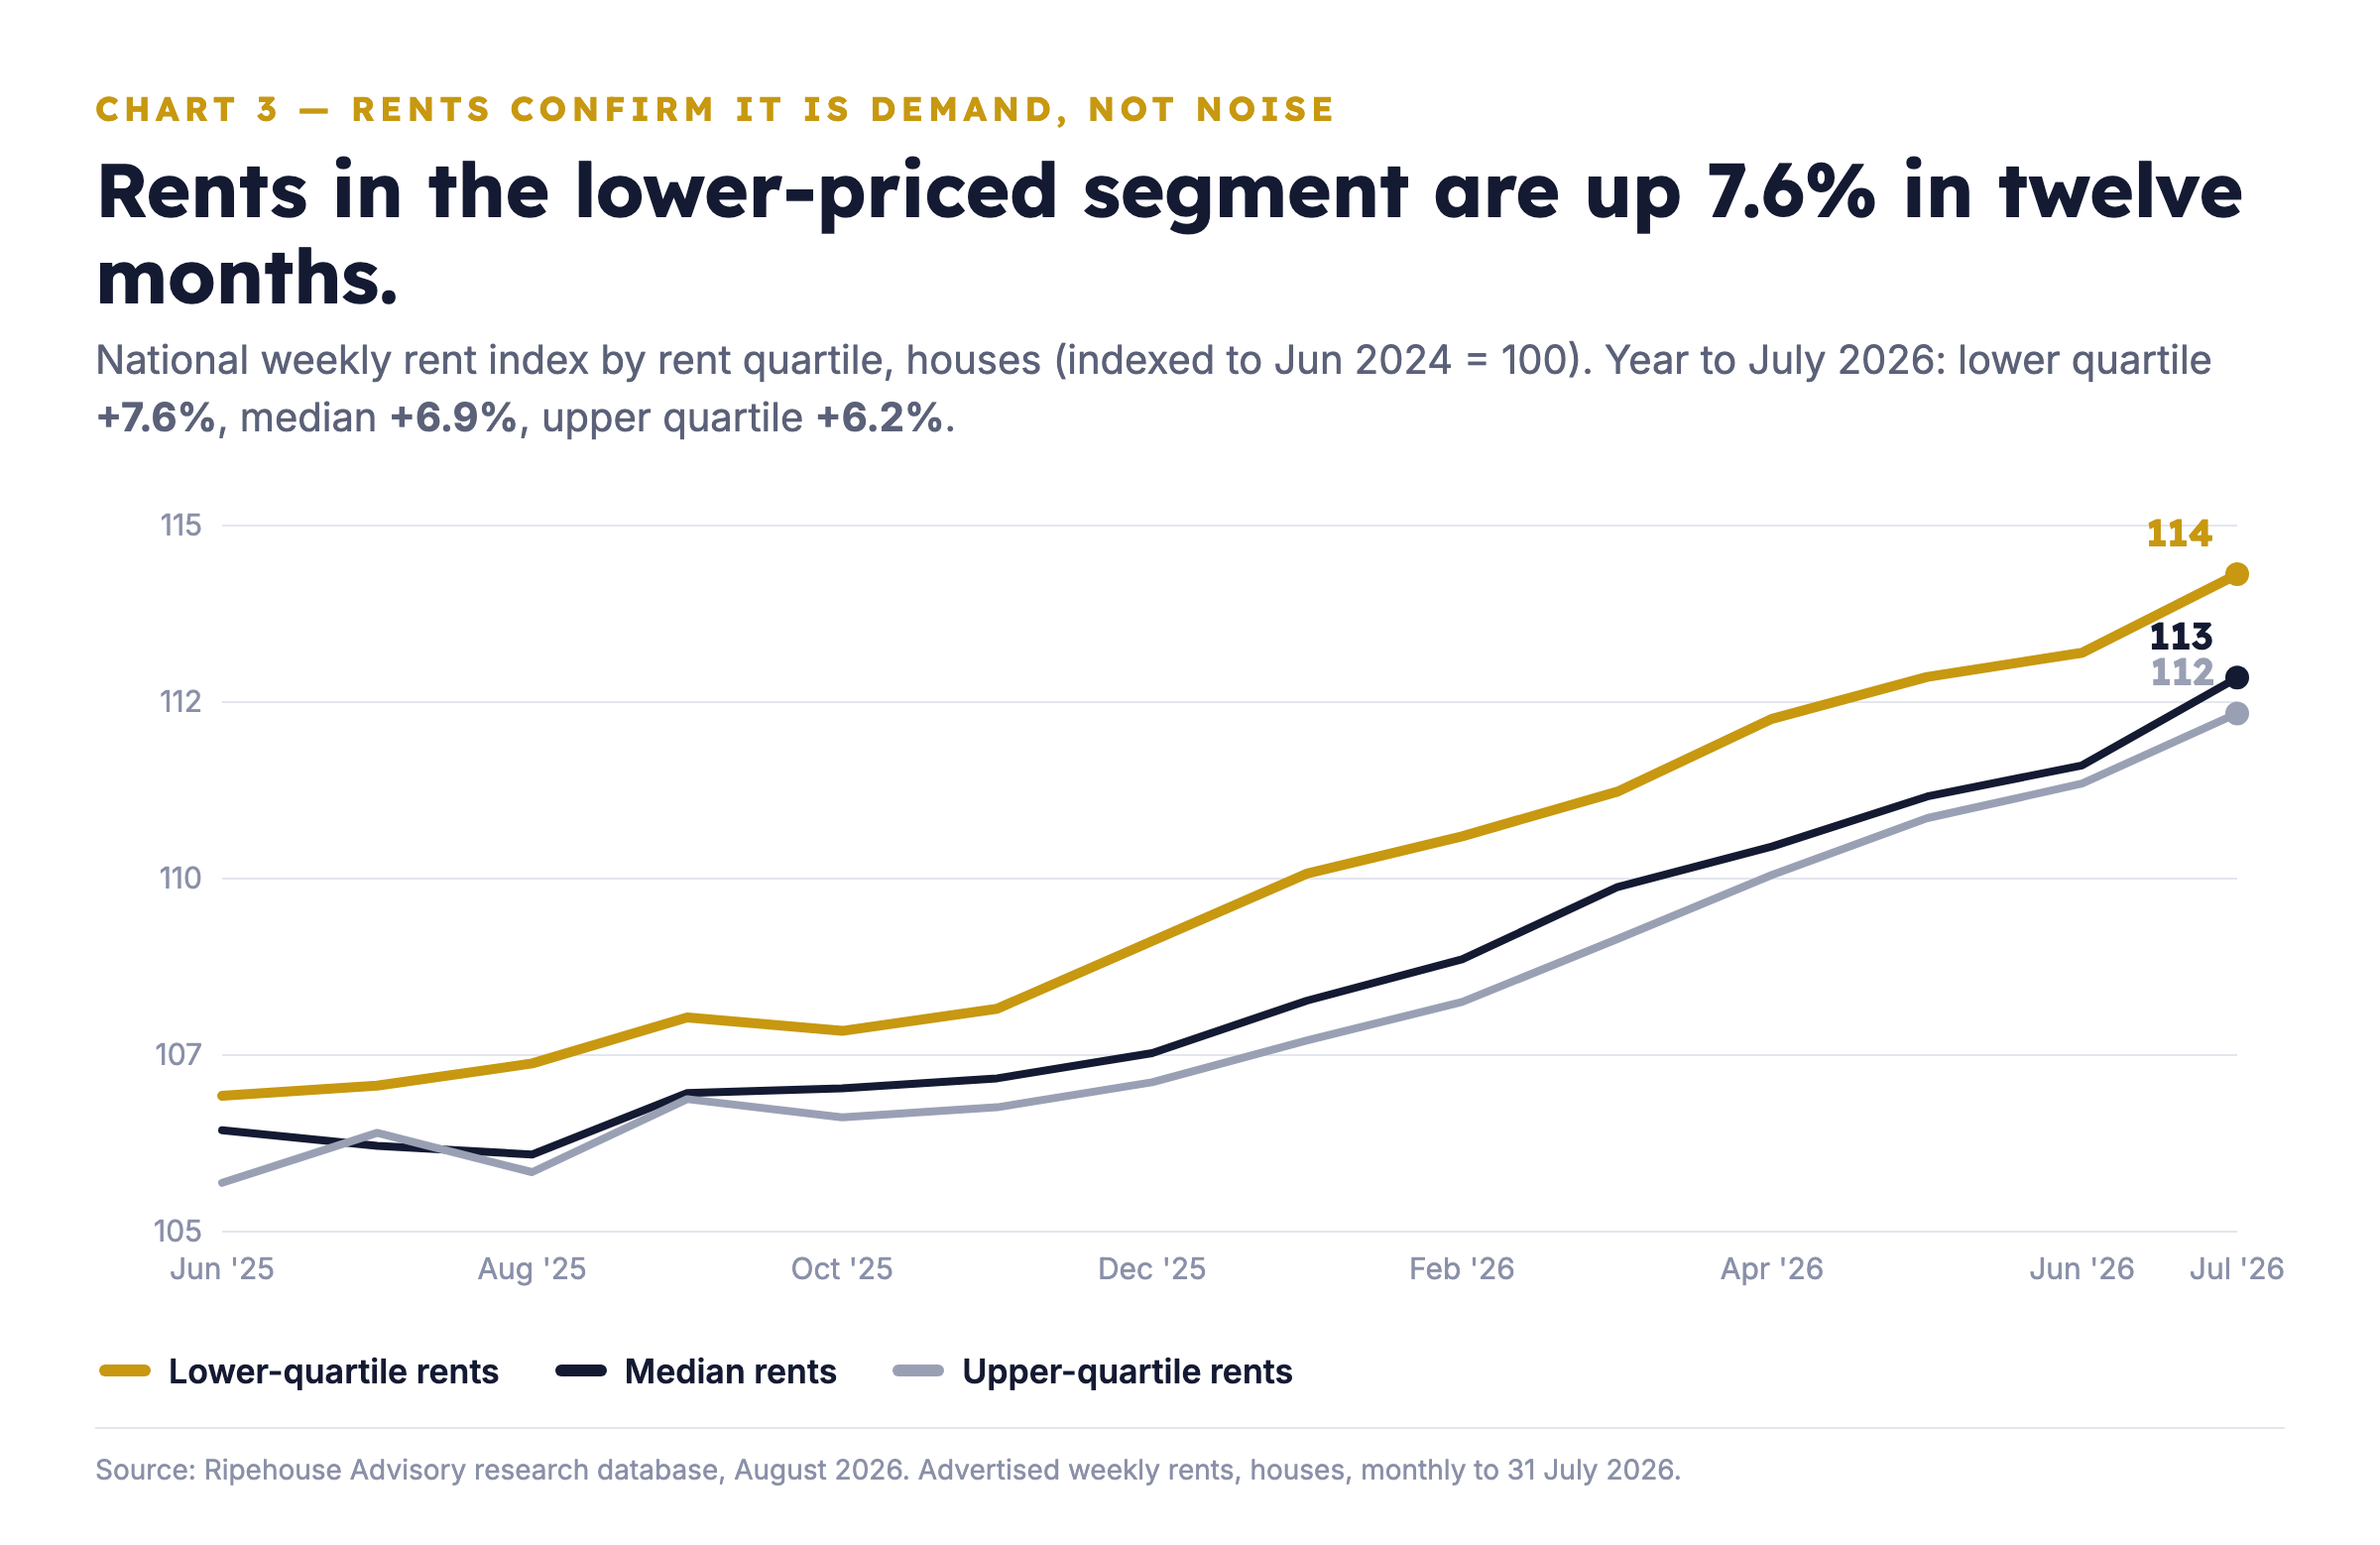
Prices can move on thin volume. Rents are harder to fake. At the lower quartile, advertised weekly rents are up 7.6% in twelve months — ahead of the median (+6.9%) and the upper quartile (+6.2%).
The implication: prices rising and rents rising in the same segment at the same time is not statistical noise. That is demand — people paying more to live there, and investors being paid more to own there.
4. The strongest-fundamentals markets have flipped and are pulling ahead
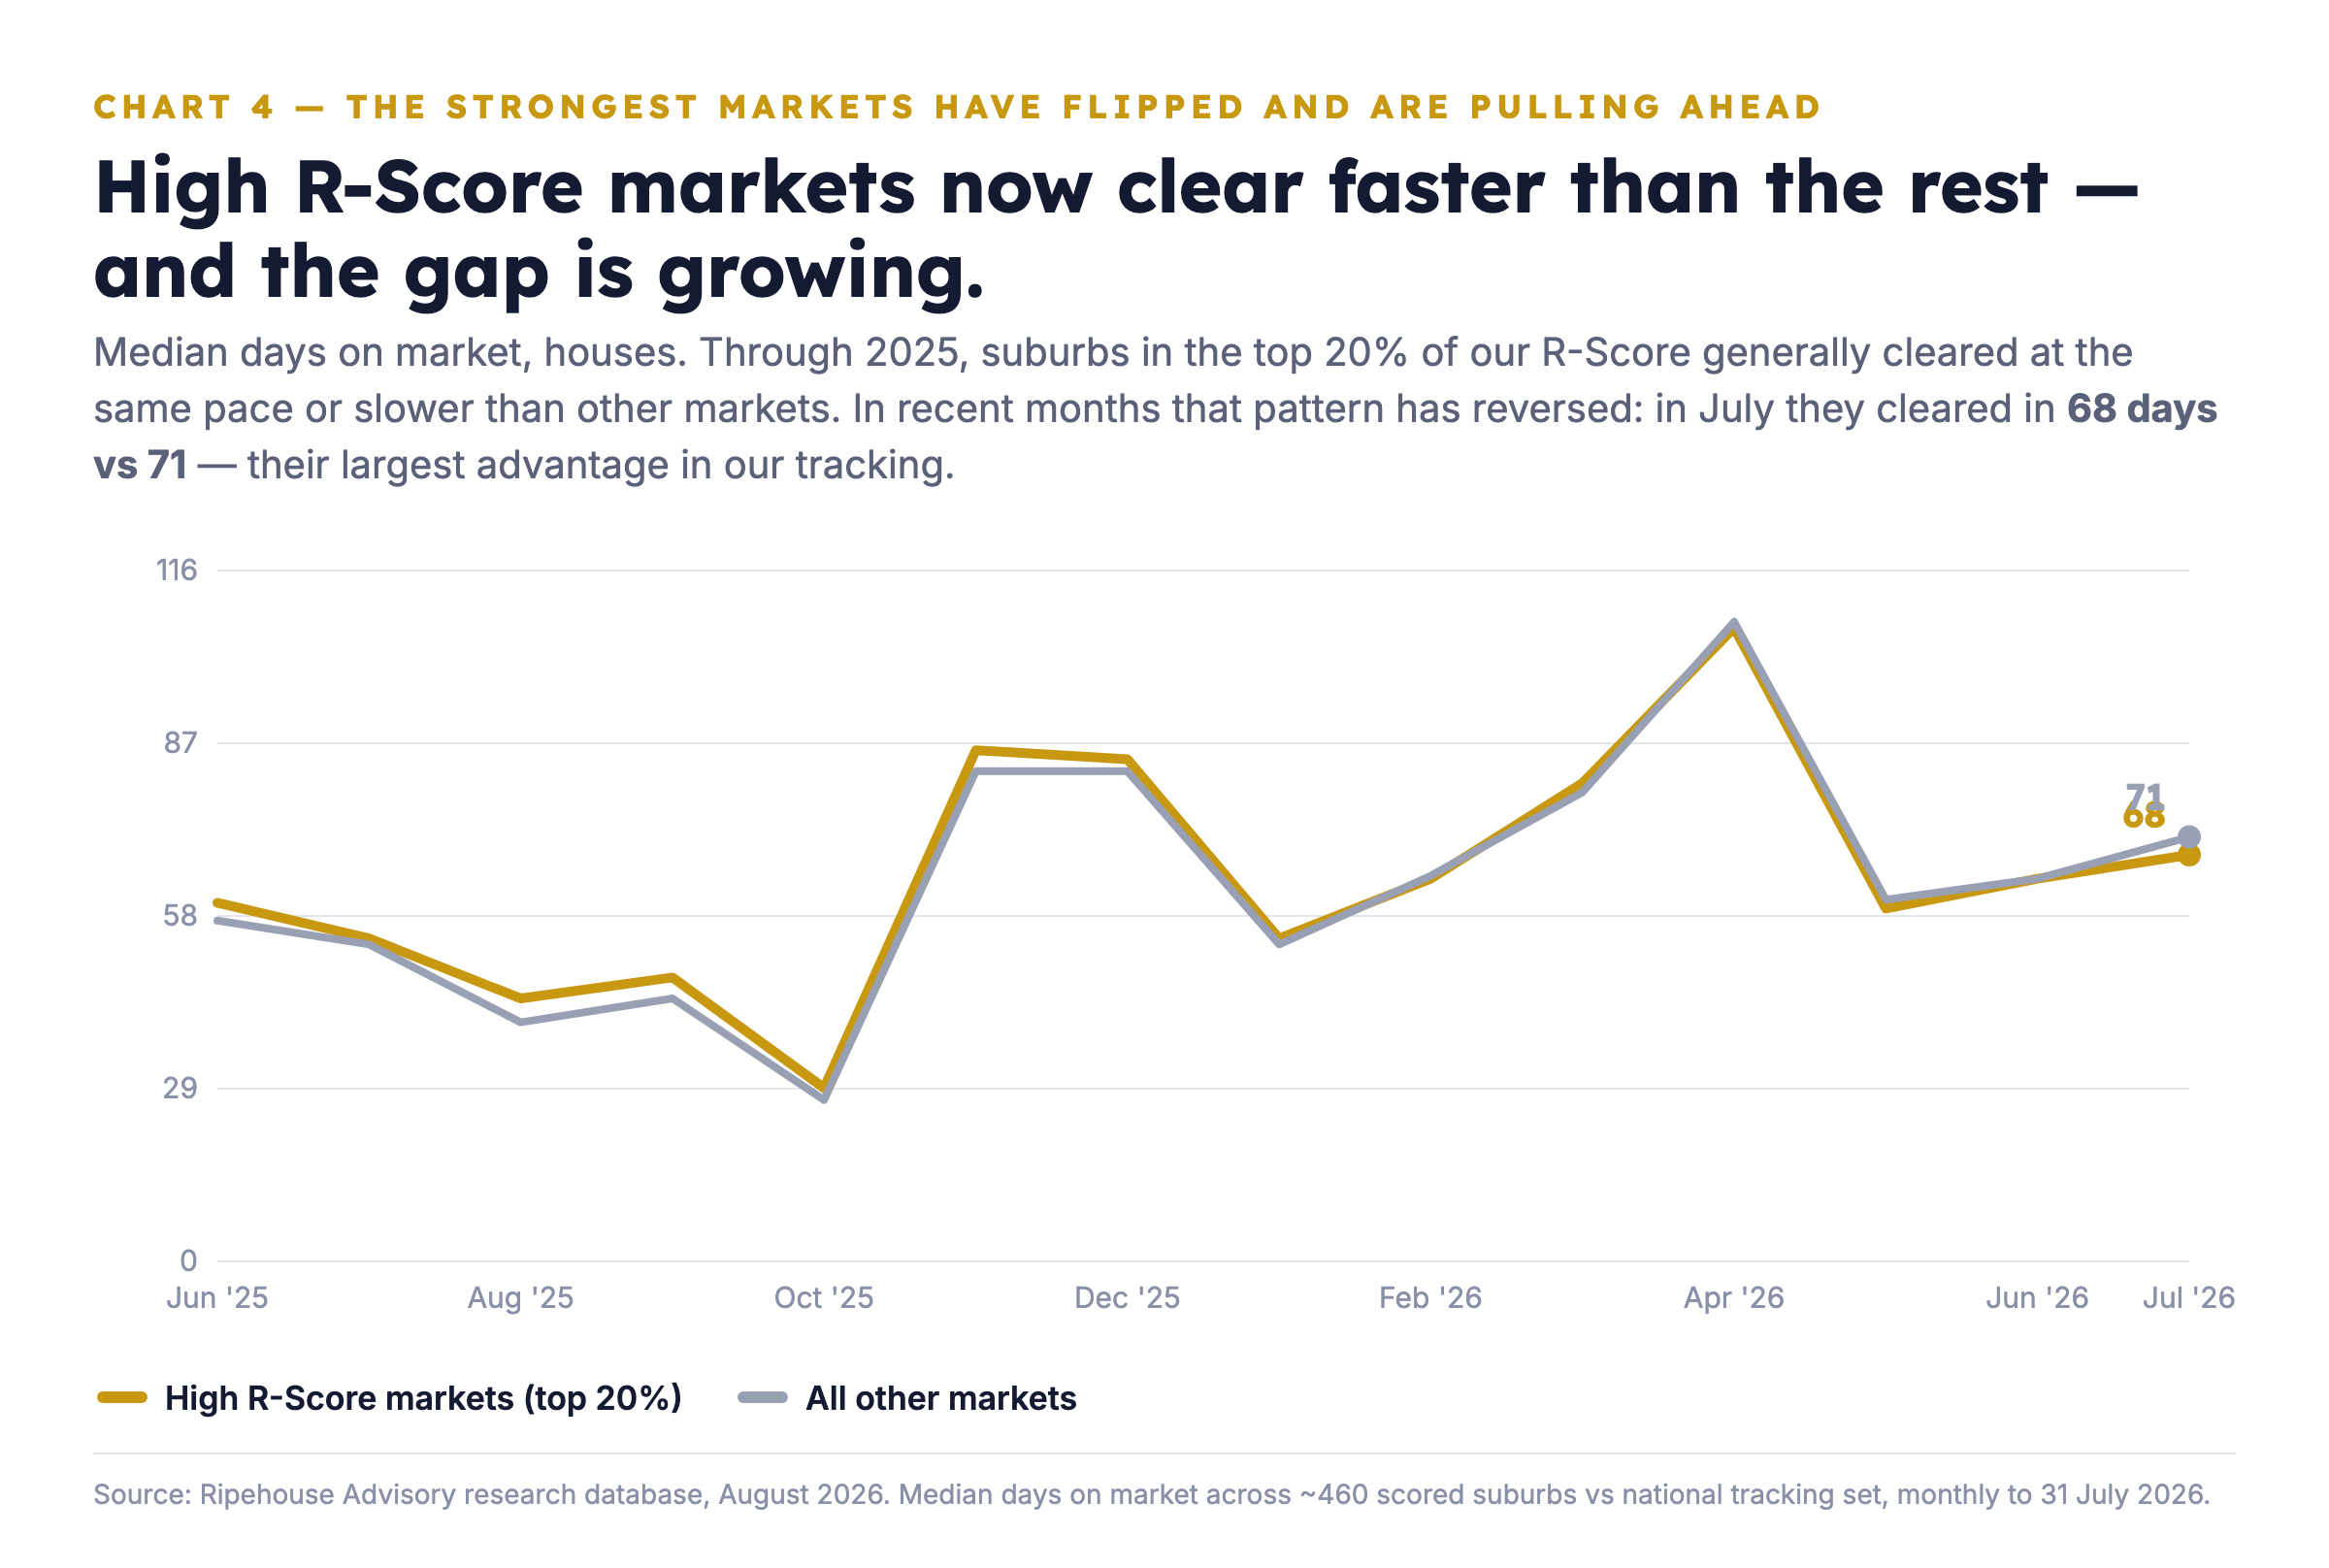
We score every market we track on fundamentals — our R-Score. Through 2025, suburbs in the top 20% of that score cleared at the same pace or slower than the rest of the country. That pattern has now reversed: in July they sold in a median of 68 days against 71 — their largest advantage in our tracking.
The implication: as the broader market loosens, the markets with the strongest underlying demand are pulling the other way. Well-selected markets don't just hold their value better — right now they are selling faster, and the gap is growing.
5. Vendors are more negotiable than they have been in two years
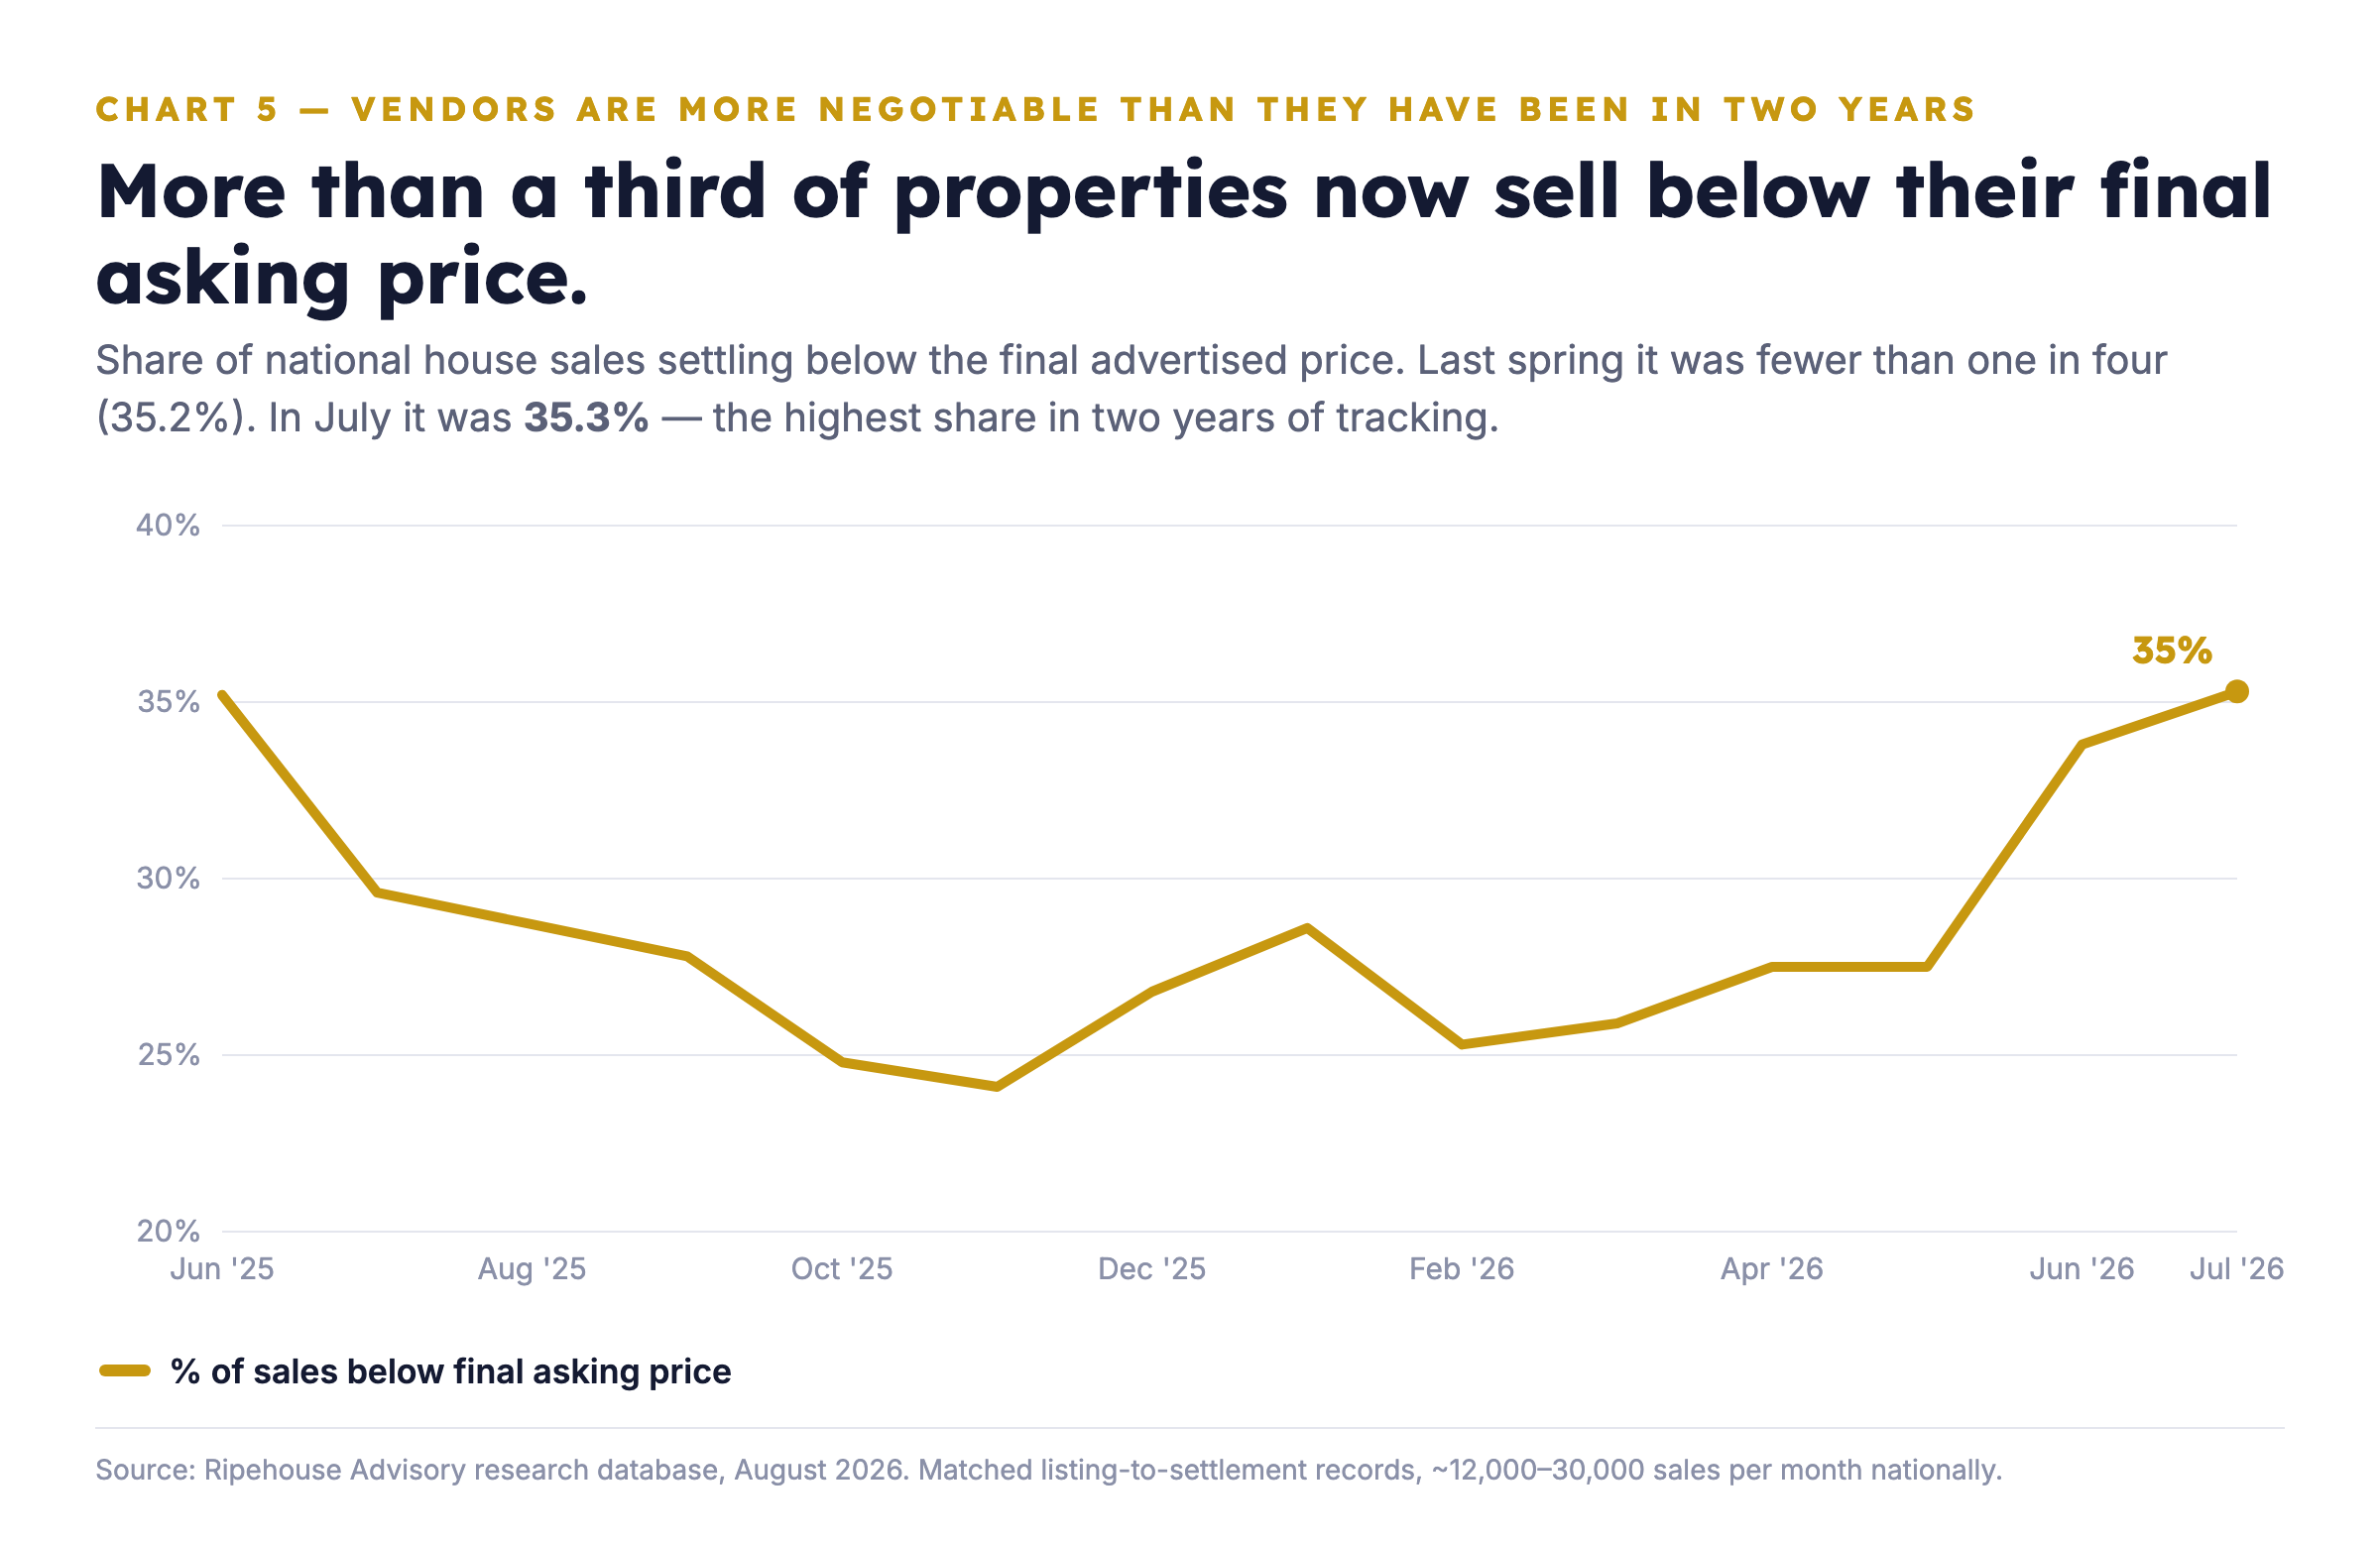
Last spring, fewer than one in four properties nationally sold below their final asking price. In July, 35.3% did — the highest share in two years of tracking, across roughly 12,000 to 30,000 matched listing-to-settlement records each month.
The implication: below-ask buying is available right now. Not as a forecast — as a measured, current condition.
What the setup looks like from here
Put the five charts together: the affordable segment is growing, its rents are rising fastest, the strongest-fundamentals markets stay tight, and vendors are negotiating at a two-year high. That combination is what a buying window looks like in the data — before it looks like one in the news.
One more date matters. The SMSF purchasing deadline driven by the proposed super changes passes on 11 August. Our expectation — and it is an expectation, not a guarantee — is that buyer competition eases further from there, into a market where vendors are already negotiating.
Our view has been consistent: August and September are shaping up as one of the better buying windows in years. We bought through the COVID window on the same principle — not because the circumstances were the same, but because the biggest gains tend to go to investors who move while others wait for certainty.
The lower-priced segment is already moving. The data says some buyers have stopped waiting.
What this means for your portfolio
That depends on your situation — your equity, your income, your structures, and what you already hold. For some investors the right move is to buy into this window. For others it is restructuring, recycling equity, or moving on a property that has stopped performing. And for some, the honest answer is "not yet" — which is exactly what we will tell you if that is what the numbers say.
If you want to know which of those applies to you, book a free discovery call with our advisory team. Fifteen minutes, a real conversation about your position, and an honest read on your next move — whether that is maximising income, maximising growth, fixing a structure, or buying while the window is open.
If there's a specific street you're weighing up right now, check its Street Score first — it's free, takes ten seconds, and tells you whether that street is pulling the suburb average up or riding on it.
Market data & R-Scores for locations in this article
Drill Down Into the Markets Mentioned Above
Inspect live monthly R-Scores, median prices, rental yields, and street-by-street scores for the cities and council areas referenced in this article:
Frequently asked questions
Is the Australian property market actually flat right now, or is that only true in some places?
It is only true in Sydney and Melbourne, which rose 4.2% over the 12 months to July and have fallen from their April peak. The rest of Australia — including Queensland, South Australia, Western Australia, Tasmania, the Northern Territory and the ACT — rose 14.8% over the same period.
Which part of the market is moving most strongly at the moment?
The affordable end is moving more strongly than the top end. In July, lower-quartile houses rose by 1.1 index points while upper-quartile houses went backwards by 0.4.
Do rising rents support the idea that demand is still strong in some parts of the market?
Yes. Lower-quartile advertised weekly rents rose 7.6% in the 12 months to July, ahead of the median at 6.9% and the upper quartile at 6.2%. The article says that combination of rising prices and rents points to real demand.
Are the stronger-fundamentals markets selling faster than other markets?
Yes. Suburbs in the top 20% of the article’s R-Score sold in a median of 68 days in July, compared with 71 days for all other markets. The article says that advantage is the largest seen in its tracking.
Is there more room to negotiate on price than there was earlier in the year?
Yes. In July, 35.3% of properties sold below their final asking price, which the article says is the highest share in two years of tracking. It describes below-ask buying as a current market condition, not a forecast.
General information only. It does not take your objectives, financial situation or needs into account, and nothing here is legal, financial, taxation or investment advice specific to your circumstances.