News · 15 August 2026 · 5 min read
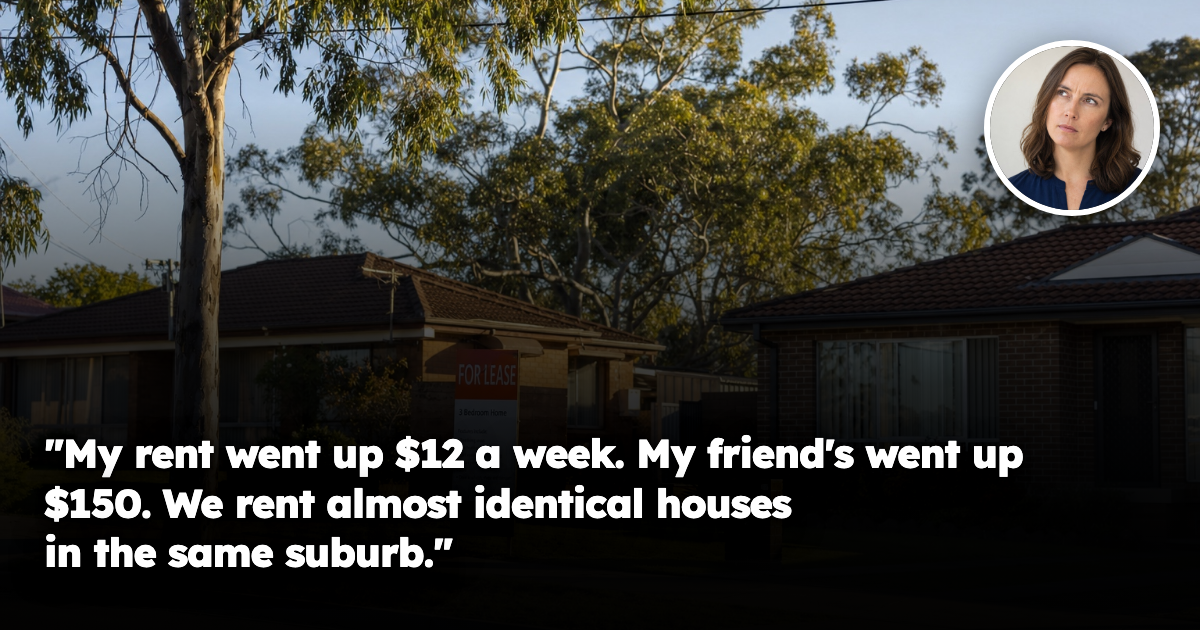
'My rent went up $12 a week. My friend's went up $150. We rent almost identical houses in the same suburb'
Rents rose in 95.6% of one state's 712 markets - but while the median moved 1.74%, some suburbs jumped $150 a week. Both numbers are true, and the gap between them is where the money is.
A question landed with us this week that we have been waiting for someone to ask.
It came from a woman in her late thirties who owns one investment property — a three-bedroom house she bought in 2018, still tenanted, still the only property she owns. She is not a portfolio investor. She reads the same headlines everybody else does, and lately those headlines have been telling her that rents are surging.
So she did the sensible thing. When her lease came up for renewal, she asked her property manager what the market was doing, took the advice, and lifted the rent $12 a week.
Then she had a conversation at a barbecue with a friend who owns a similar house, in the same suburb, roughly the same age, roughly the same condition. His last increase was $150 a week.
Her question to us was blunt: "Same suburb, same market, same year. How is that possible — and which one of us got it wrong?"
The backdrop she was reading
The national picture genuinely is tight, and it is getting tighter.
Asking rents rose across every capital city in the three months to July. In one state, of 712 house and unit markets analysed, 681 — 95.6 per cent — recorded a rent increase over twelve months. In one capital, tenants copped increases of at least $1,000 a year across 150 suburbs for units and 176 for houses.
Behind it sits a supply story. June-quarter lending data showed home loans down 5.4 per cent in a single quarter — a drop of 7,711 loans — and 4,966 of that reduction was investors, an 8.6 per cent fall in three months and more than $4 billion less lent to landlords. Fewer investors buying established rentals, with tenant demand unchanged, does what it always does.
So her instinct was right. The market is rising. That part is not in dispute.
The part the headline can't tell her
Here is the number that answers her actual question, and it comes from the same dataset as the 95.6 per cent.
In that state, while the median weekly rent moved 1.74 per cent for the quarter, some individual suburbs recorded increases of up to $150 a week.
Sit with those two figures together, because they describe the same market in the same quarter. One is a fractional percentage. The other is a five-figure annual difference in income on a single property. Both are true. Both are correctly reported. And an owner who reads only the first one will make a materially different decision from an owner who reads the second.
This is the thing almost nobody internalises about property data: a median is not a description of the market. It is an average of markets behaving nothing like each other. When a suburb median rises 1.74 per cent, that number is perfectly consistent with one street letting at a $150 premium and the street behind it not moving at all. The average conceals the spread, and the spread is where the money is.
Two houses, one suburb, two different assets
There is an even sharper version of this in the same lending data.
The federal tax changes that triggered the investor exit applied to the entire country, identically, on the same day. Every state and territory got the same rules. Yet in that single quarter, investor lending fell hard across the five largest jurisdictions — and rose in the three smallest.
One policy. One country. One quarter. Opposite outcomes.
If a national tax change cannot produce a national result across eight jurisdictions, it should not surprise anyone that a suburb average cannot produce a reliable answer across four hundred properties.
And that fractal keeps going down. Our research consistently finds a 20 to 30 per cent spread in effective yield between the best and worst streets inside a single suburb — same postcode, same median, same school catchment, same train station, same council rates, same tax law to the letter. Not asking rents, which are just a hopeful number in an advertisement. Achieved rents, real vacancy duration, and true days-on-market. One street lets in four days to a queue of applicants. The one behind it sits five weeks, lets at a discount, and the tenant is gone in eleven months.
That is the entire answer to her question. Her friend was not smarter, luckier or greedier. He was very probably on a better run of road — and neither of them knew it, because neither of them had ever looked below suburb level. It is the same mechanism that explains why a vacancy rate of 0.4 per cent can sit alongside rents that refuse to move, and why an owner can spend $210,000 on a renovation and add nothing.
So which one of them got it wrong?
Possibly neither. Possibly both. It depends on a number neither of them has.
If her street genuinely supports $150 more, then $12 was not restraint — it was a quiet, compounding donation, and the tenant she was being fair to could have paid market rent and stayed anyway. If her street does not support it, then $12 was correct and her friend has priced above what his location holds. He will get away with it once while vacancies are tight, then wear a vacancy run and a turnover that costs him more than the increase gained.
Both errors are invisible from the suburb median. Both are measurable below it.
The practical sequence is short:
1. Use achieved figures, not advertised ones. What properties actually let for, and how long they sat — the number of people who actually walk through the door is the leading indicator of all of it.
2. Get below the suburb. Your street, your stock type, your price bracket — not the postcode.
3. Price the tenant, not just the property. A four-year tenant who pays on time has a real dollar value. Model the vacancy and re-letting cost before you chase the last $20.
4. Ask the diagnostic question: is my rent tracking my street, or tracking my mortgage? Only one of those is a market signal.
What this means if you own property
Read the environment honestly. Rents are rising in the overwhelming majority of markets. Investors are leaving established stock in numbers, which tightens rental supply rather than loosening it. Tenant demand has not moved. That is a constructive backdrop for anyone who owns the right asset.
But it is a worse backdrop than it used to be for owning the wrong one. The era when you could buy almost anywhere and be carried along by a rising tide has ended, and what replaces it is a market that sorts hard — rewarding the well-selected property and quietly punishing the average one while the headline number tells everybody things are fine.
That is not an argument against owning property. It is an argument against owning an average.
She researched a market. She rents out a street. Almost everybody does it in that order.
If there's a specific street you're weighing up right now, check its Street Score first — it's free, takes ten seconds, and tells you whether that street is pulling the suburb average up or riding on it.
Frequently asked questions
How can two almost identical rental houses in the same suburb end up with very different rent increases in Australia?
Because suburb medians hide big differences below suburb level. The article says one property can be on a street that supports much higher achieved rents and faster leasing, while a nearby street may not move at all.
What does the article say about rent growth in the current market?
Rents are rising in the overwhelming majority of markets, and asking rents increased across every capital city in the three months to July. In one state, 95.6% of the 712 house and unit markets analysed recorded a rent increase over 12 months.
Why can a suburb’s median rent rise only a little when some landlords are getting much bigger increases?
A median is only an average across different parts of the market, so it can hide a wide spread of outcomes. The article says some suburbs recorded increases of up to $150 a week even though the state median weekly rent rose just 1.74% for the quarter.
What should an investor look at before increasing the rent on a tenancy?
The article says to use achieved rents, not advertised asking rents, and to get below suburb level to the street, stock type and price bracket. It also says to weigh vacancy and re-letting costs before chasing a higher rent.
What is the main risk of relying only on suburb-wide rental data?
You can misprice the property either way: undercharging and missing income, or overpricing and causing vacancy and turnover. The article says both mistakes are invisible from the suburb median but measurable below it.
General information only. It does not take your objectives, financial situation or needs into account, and nothing here is legal, financial, taxation or investment advice specific to your circumstances.