News · 12 August 2026 · 6 min read
'My land is completely flat. The council has mapped 1.5 square metres of it as a landslide zone'
A planning overlay flagged 33,000 properties as highly susceptible to landslide, including flat streets, garden waste piles and 30cm retaining walls. It is now proposed to be cut to around 6,000 — and the reversal proves something important about how property risk is actually priced.
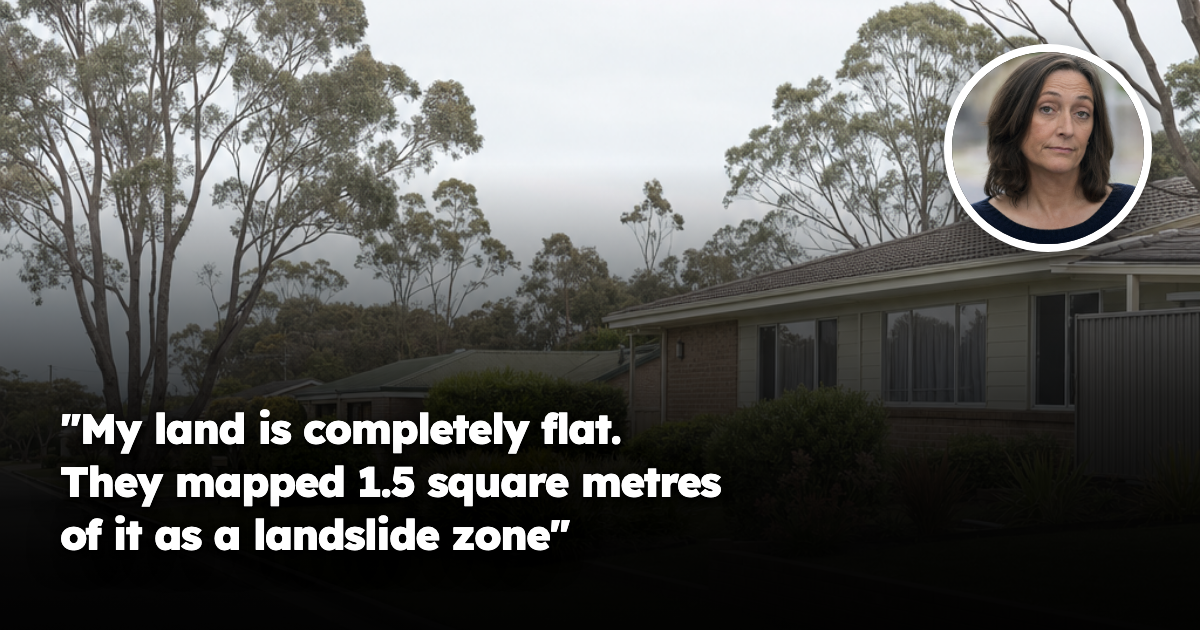
An owner came to us late last year having received a text message. Not a letter from a solicitor, not a notice from a bank — a text, telling her that her property was about to be captured by a new planning overlay identifying land highly susceptible to landslide. She owns her home and one investment property a few streets away. Both were flagged.
Her question was blunt: the land is flat. There is a low brick retaining wall along one garden bed, maybe thirty centimetres high. Nothing has moved, slipped or subsided in the two decades she has owned it. How can a government map call her block a landslide risk, and what does that do to what her properties are worth?
She was right about the ground and right to be worried anyway — two different problems. Nine months later, the authority that drew the map has effectively agreed with her.
What actually happened
An interim overlay was introduced across a large coastal municipality after a board of inquiry into a house that slid down an escarpment. It captured land classified as highly susceptible to landslide: around 33,000 lots, about 27,000 residential — close to forty per cent of the homes in the area. Owners inside it generally need a planning permit before most development, including things rarely thought of as development: removing vegetation, changing drainage, works affecting land stability.
Then the detail that made owners furious. The mapping picked up small retaining walls, flat asphalted streets, piles of garden waste and otherwise level ground. One owner was told a 1.5 square metre patch at the front of a flat, stable block was a slip zone. Another had four square metres flagged on a half-metre slope. One resident's home was captured while the driveway that actually pools water in heavy rain was not. Base data was more than a decade old, and in many cases nobody had visited the site.
This month, after a review using expert advice, updated aerial survey data and site inspections, the shire moved to ask the state to cut the overlay from about 33,000 properties to around 6,000 — a reduction of over eighty per cent.
One thing needs saying before anyone calls that a scandal: the event that triggered all of this was caused by a burst water main, and the overlay would not have prevented it. It also exists partly so landslide risk can lawfully be weighed in a planning decision at all.
This is not a story about a council inventing a risk. It is about resolution.
The answer: the map was measuring the wrong thing at the wrong scale
Broad susceptibility mapping answers a regional question — where, across tens of thousands of hectares, is instability plausible? It reads slope from elevation data across a whole municipality at once, and cannot tell a natural escarpment from a garden retaining wall, because at that resolution both are just a steep change in height. The land did not change. The instrument was too blunt for the question owners were about to be asked about their own back yard.
And here is the part that matters far more than the embarrassment: for many owners, only part of the lot was ever inside the overlay. Development could continue as normal on the rest. The boundary did not run around suburbs, or even around streets. It ran through individual blocks — one garden bed, one corner, one metre-and-a-half patch of lawn.
That is the whole argument we make about property, arriving from an unexpected direction. A government drew a line that changed what an owner was permitted to do, and that line was finer than a single property. Whatever else you think about the mapping, it concedes the point: land is not uniform at the suburb level, and it is not uniform at the street level either.
It is the same mechanism as a redrawn flood map repricing a house that has never taken water, or an easement on title quietly removing the buildable area: a third party's line, not the owner's intention, sets the ceiling.
Two houses eighty metres apart on the same street, sharing a postcode, a median and a council, can sit a metre apart in level, drain in opposite directions, and carry different permit obligations. A suburb median averages the high side and the low side of every street and reports the mean. Our own street-level work finds the same shape everywhere: the gap in effective yield between the best and worst streets inside a single suburb routinely runs twenty to thirty per cent, once you measure achieved rents, real vacancy duration and true days on market rather than suburb averages and advertised prices.
What this means for you
If a mapping notice lands on a property you own, three steps in this order.
Find out which document you are in, and what portion of the lot it captures. A susceptibility map and a planning overlay are different instruments; only the overlay carries permit obligations. And "my property is in the overlay" versus "a four-square-metre corner of it is" are wildly different facts — the second is often what a notice actually means.
If the mapping looks wrong, produce what the model does not have: a surveyor standing on your block. A registered survey of levels costs a few hundred dollars and is the only evidence that reliably beats a desktop assessment. The reversal here happened because inspections were finally done.
Then price the insurance. As we've written before, an insurance premium is the most honest second opinion an owner ever gets on an address, because the underwriter puts their own money behind it. If a hazard classification is real and material, the premium will say so long before the market does.
The part that should interest investors
For nine months, tens of thousands of properties carried a public classification suggesting a risk that, on the authority's own revised assessment, around eighty-two per cent of them do not carry. Some owners will have sold; some buyers walked. Meanwhile, roughly 6,000 properties are expected to remain inside the mapping — and those were never the story, because outrage is not distributed according to accuracy.
When pricing follows a headline classification rather than a measured one, two errors happen at once: sound assets get discounted for risk they do not carry, and genuinely constrained assets get bought at full price by someone who assumed the outrage was universal. Both errors live below the suburb.
None of this is an argument against owning property on a hillside or near a coast. Elevated, well-drained land is desirable for reasons that predate any overlay, and will stay desirable once the mapping is corrected. The argument is narrower: value is set by what you are permitted to do with your particular patch of ground, and that is knowable, cheaply, before you buy — not from a median, and not from a map at the wrong scale.
She checked both of hers. The home came back with a corner of the front garden clipped by the line, on ground that falls away from the house. The investment property, two streets over and identical on every suburb metric, sat at the low end of a gentle fall with water running toward it. Same notice, same postcode, same median. Two different assets.
They always had been.
If there's a specific street you're weighing up right now, check its Street Score first — it's free, takes ten seconds, and tells you whether that street is pulling the suburb average up or riding on it.
Frequently asked questions
What does it mean if a council landslide overlay covers only part of my property in Australia?
It means the planning controls may apply only to the portion inside the overlay, not necessarily the whole lot. In this article, some owners had just a small corner, garden bed or driveway area captured, and that can still trigger permit obligations for certain works.
Can a flat block in a council landslide zone still be mapped as high risk?
Yes. The article says the old mapping was too blunt and could pick up flat streets, small retaining walls and piles of garden waste as landslide-susceptible areas. The later review found the map was measuring the wrong thing at the wrong scale.
If I get a notice that my land is in a landslide overlay, what should I do first?
First, check exactly which document you are in and what part of the lot it captures, because a map and a planning overlay are not the same thing. If it still looks wrong, the article says a registered surveyor’s on-site levels survey is the most reliable evidence.
Why did the council reduce the landslide overlay from 33,000 properties to about 6,000?
After expert advice, updated aerial data and site inspections, the shire concluded the original overlay was over-broad. It had included many properties where the desktop mapping had not distinguished real slope instability from minor features like retaining walls or level ground.
What is the main risk for property owners when a hazard map is drawn at the wrong scale?
Good properties can be discounted for a risk they do not actually carry, while genuinely constrained properties may be bought without being properly recognised. The article’s point is that property value is set by what you can do with the specific patch of land, not by suburb averages.
General information only. It does not take your objectives, financial situation or needs into account, and nothing here is legal, financial, taxation or investment advice specific to your circumstances.