News · 6 August 2026 · 10 min read
‘My house has been mapped as flood risk. It has never flooded. Nothing has changed except a line on a map’
She has owned the house 25 years and it has never taken water. Then new draft mapping shaded her block, and her investment property two streets away. The national evidence says the line moves the price — $42.2 billion wiped from mapped homes, a $75,500 gap on a typical three-bedroom house, and a compounding growth penalty worth up to $900,000 over 15 years. But the discount is driven by perceived vulnerability, not measured exposure, which is why a suburb-level flood statistic tells you almost nothing about your own block.
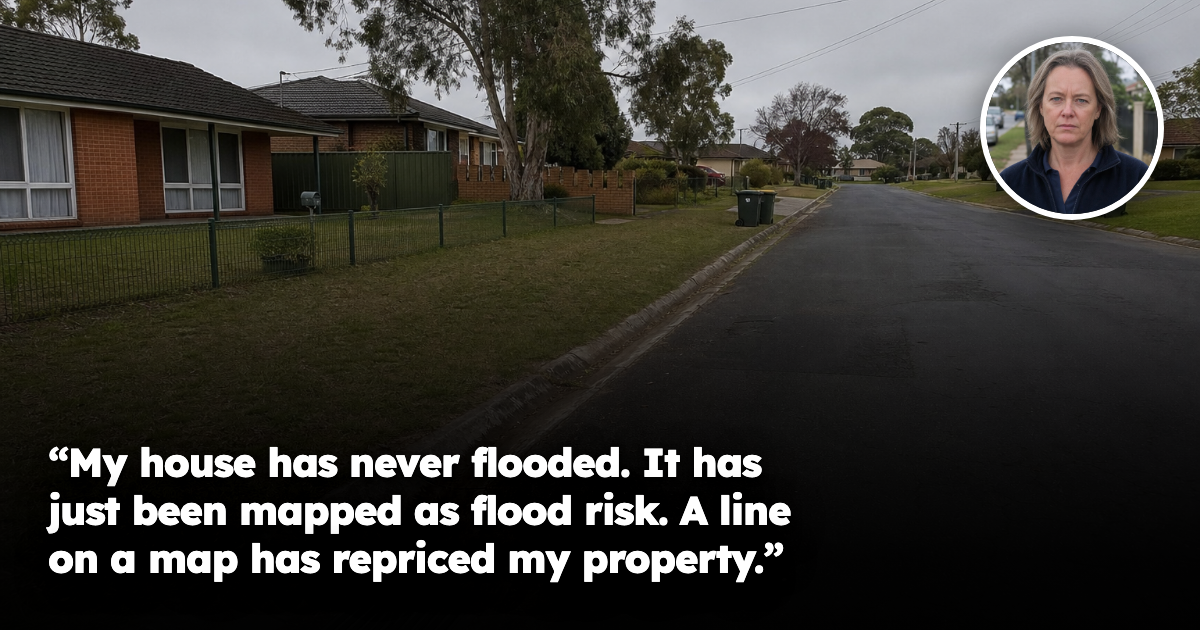
She has owned the house for twenty-five years. In that time the street has never taken water — not in the big storms, not in the wet years, not once. Then a notice arrived about new draft flood mapping, she typed her address into the viewer, and there it was: her block, shaded.
Two streets away, her investment property was shaded too.
"Nothing has happened to either house," she told us. "No water, no damage, no claim, no change to the land. Someone has redrawn a boundary on a computer and I'm now told I own two flood-risk properties. Is my property actually worth less than it was last month — and is there anything I can do about it?"
It is the question we are getting most often at the moment, and it has a genuinely uncomfortable answer followed by a much more useful one.
First, the uncomfortable part: yes, the map moves the price
There is now hard national evidence on this, and it is not gentle.
More than two million Australian homes — roughly one in six — sit inside mapped flood zones. Of those, at least 70 per cent have already experienced a measurable reduction in value as a direct result of that mapped risk. Collectively, homes in the affected regions are worth about $42.2 billion less than they would be without it.
Averaged across every affected dwelling, that is a penalty of around $37,000. For a typical three-bedroom house at risk of flooding, measured against a comparable flood-free home, the gap is closer to $75,500. In some high-value areas it exceeds $500,000 per home.
Critically, this is not a climate forecast. It is not a projection of what might happen. It is a measurement of what the market has already done to the price of homes inside mapped zones. The discount exists now.
And it compounds. Since 2000, flood-prone properties have recorded cumulative growth of 394 per cent against 416 per cent for flood-free properties. A 22 percentage point gap sounds academic until you apply it — on a $1 million property that is roughly $220,000 of equity that simply never accumulated. In the worst-affected regions the gap over the fifteen years to 2025 has run as high as 48 percentage points, which on the same $1 million property approaches $900,000 in forgone equity.
So when she asks whether her house is worth less than it was last month: on the balance of the evidence, probably, and the bigger cost is not the discount today but the slower compounding from here.
There is a second-order effect too. The prudential regulator's own climate stress testing has warned that on current trends around one in four Australian homes could be uninsured by 2050, with the resulting protection gap flowing through to the banks that lend against them. Insurance and lending are the transmission mechanism. A property that is expensive to insure is harder to sell, and a property that is hard to insure is harder to finance — which shrinks the buyer pool, which shows up in the price. That chain is why a line on a map has teeth.
It is also a familiar shape. This is the third time this year we have written about an owner whose position changed because an authority issued a document rather than because anything happened to the bricks — the same mechanism as a council revaluation quietly pushing long-term owners over the land tax threshold.
Now the part almost nobody knows: the discount has very little to do with the actual risk
Here is where it gets genuinely strange, and where the honest answer to her question starts.
If the flood discount were a rational pricing of hazard, you would expect it to track exposure. More exposure, bigger discount. It does not. In the same national dataset:
- One south-east Queensland coastal market has only 16 per cent of its homes classified as flood-prone — and those homes carry a 48 per cent discount.
- A market a few kilometres along the same coastline has nearly 80 per cent of its homes exposed — and the discount is 26 per cent.
- A northern New South Wales river town has 61 per cent of its housing technically flood-prone — and its flood-prone homes have historically been valued higher than its flood-free ones.
Read those three again. Exposure of 16 per cent produces a 48 per cent discount. Exposure of 80 per cent produces half that. Exposure of 61 per cent produces a premium.
The variable driving the price is not how likely the property is to flood. It is how visibly and recently the risk has been demonstrated, and whether anything has been built to manage it. The river town with the premium has levees and drainage upgrades with a long track record of holding — and independent economic work puts the benefit of that kind of mitigation at roughly twice its cost, and in some cases up to five times.
The market, in other words, is pricing perception. Where a flood has recently happened and been televised, everything nearby is punished regardless of elevation. Where infrastructure has quietly worked for decades, exposure is forgiven.
That is the whole answer to her question, and it cuts both ways. Being inside the line is not a verdict on her house. It is a verdict on how her area is currently perceived.
Why a suburb-level flood statistic is close to useless
This is where the research lands directly on something we argue constantly.
Suppose you look up her suburb and find that 30 per cent of its homes are mapped. What have you learned about her house? Essentially nothing. Flood risk is set by elevation, by the fall of the land, by where the overland flow path runs, by the capacity of the stormwater pit at the corner, by whether the block sits on the high side or the low side of the street, by floor height above the kerb, by whether a swale was ever built across the rear boundary. Two houses eighty metres apart, same street, same era, same construction, can be a metre apart in level — and a metre is the entire argument.
A suburb average takes the high side and the low side of every street in the postcode and reports the mean. It is structurally incapable of telling you which one you are buying.
This is the same failure we mapped out when we looked at what a school catchment boundary does to two identical houses on opposite sides of the line — a published boundary that runs through a suburb, invisible to every suburb-level metric. Flood mapping is the same species of problem, with two differences that make it worse: the line is drawn by hydrology rather than administration, so it can cut diagonally through blocks and follow the back fences of one side of a street only; and unlike a catchment, it is redrawn whenever the modelling improves.
Which is precisely what has happened this year. New draft stormwater mapping released across Melbourne's middle suburbs in the middle of 2026 newly flagged tens of thousands of homes that had never previously appeared on a flood map — and in some suburbs the number of mapped properties rose roughly eightfold. Not one of those houses got wetter. The model got better.
That is also the warning for owners who feel safe. The same national research makes the point explicitly: if you own in a region where flood risk is already suppressing values but your property is not currently exposed, your property may still lose value if the mapped risk later extends to it. Sitting outside the line today is not a permanent condition.
What she should actually do — and what we told her
Four things, in order.
1. Establish which document you are actually in. A flood map and a planning overlay are not the same instrument. Catchment authorities publish hazard mapping; councils apply planning overlays through a scheme amendment, and it is the overlay that carries the permit requirements, minimum floor levels and build restrictions that constrain what you can do with the land. Draft mapping is an input to that process, not the outcome of it. Find out precisely which one applies to each of her two properties, because the answer determines everything else — and it is often different for two properties in the same suburb.
2. Use the consultation window, and bring your own evidence. Draft mapping is published in draft for a reason: there is a submission process, and councils and catchment authorities do refine mapping in response to evidence. A registered surveyor's floor-level and site-level survey costs a few hundred dollars and produces the one thing modelling at the catchment scale does not have — the actual height of your actual floor. We have to be honest here: we could not find a documented case of an owner having a mapping designation removed outright, and you should not budget for that outcome. But an accurate floor level is worth having regardless, because it is also the single most useful document you can put in front of an insurer.
3. Price the insurance before you assume the damage. Get live quotes on both properties now, not at renewal. The premium is the market's actual read on the risk, and it is far more informative than the shading on a map. If the premium barely moves, the market has not repriced the asset and the map has cost her nothing real. If it moves hard, she has found out early, and she has a number to work with rather than a worry.
4. Then look at the street, not the suburb. This is the part that decides whether either property is genuinely impaired. Where does the block sit relative to the low point of the street? What is the floor height above the kerb? Where does the overland flow actually run in a heavy event — and has the drainage infrastructure been upgraded, or is it the original 1970s system? Is there mitigation planned or funded in the catchment? On days on market, on vacancy, on rental depth, is her street behaving differently to the streets around it, or is it performing exactly as it always has?
When we ran that work on her two properties, the answers were not the same. Her home sits high, well above the kerb, with the overland flow path running down the far side of the road and away. Her investment property sits at the low end of its street, and the fall of the land brings water toward it. Same suburb. Same mapping notice. Two completely different assets, and only one of them has a real problem to manage.
That distinction is invisible at suburb level, and it is the entire difference between selling something you should have kept and keeping something you should have sold. It is also the difference between finding out now, with time to act, and finding out the way an owner does when a problem surfaces two weeks before settlement — when the only remaining options are bad ones.
The reframe that matters
Her instinct — that it is outrageous to be repriced by an administrative act — is understandable, but it points at the wrong target.
The mapping did not create the risk. The water always did or did not run across that block; the only thing that changed is that it has now been written down. What the map really did was remove an information advantage — one that, until this year, was held by whoever had bothered to look at the topography themselves.
And that is why the market's inconsistency is the opportunity here rather than the injustice. When pricing is driven by perception rather than by measured exposure, some properties are being discounted for a risk they do not carry, and others are being bought at full price with a risk nobody has priced in at all. Both errors are found the same way: below the suburb, at the level of the street and the individual block.
Property remains one of the most reliable engines of long-term wealth in this country, and the arrival of published risk data does not change that. If anything it strengthens the case for doing the work, because the reward for accuracy just went up. The owners who will do badly out of the next decade are the ones who bought a postcode. The ones who will do well are the ones who knew, before they signed, exactly where the water goes.
A line on a map is not a valuation. It is a prompt to go and find out what you actually own.
If there's a specific street you're weighing up right now, check its Street Score first — it's free, takes ten seconds, and tells you whether that street is pulling the suburb average up or riding on it.
Market data & R-Scores for locations in this article
Drill Down Into the Markets Mentioned Above
Inspect live monthly R-Scores, median prices, rental yields, and street-by-street scores for the cities and council areas referenced in this article:
Frequently asked questions
If my house has been added to a new flood map in Australia, does that automatically mean it is worth less?
The article says mapped flood risk does usually reduce value, because the market prices perceived vulnerability. But it also stresses that the shading is not a verdict on your specific house — the real impact depends on the block, the street and how the risk is being managed.
Why can two homes in the same suburb have very different flood risk even if only one is shaded on the map?
Flood risk is driven by local factors such as elevation, the fall of the land, stormwater capacity, floor height and overland flow paths. A suburb average can’t tell you which side of the street your block is on or where the water actually runs.
What is the difference between flood mapping and a planning overlay?
A flood map is the hazard mapping, while a planning overlay is the instrument councils use through a scheme amendment. The overlay is what can trigger permit requirements, minimum floor levels and build restrictions.
Can draft flood mapping be challenged if my property has never flooded?
The article says draft mapping is published for consultation and councils or catchment authorities can refine it in response to evidence. It suggests getting a registered surveyor’s floor-level and site-level survey, although it does not say owners should expect the mapping designation to be removed outright.
What should I check first if my property has just been mapped as flood risk?
First establish exactly which document applies — the flood map or the planning overlay — because they are not the same. Then check insurance pricing, because the article says the premium is the market’s actual read on risk and may be more informative than the map shading.
General information only. It does not take your objectives, financial situation or needs into account, and nothing here is legal, financial, taxation or investment advice specific to your circumstances.