News · 28 August 2026 · 4 min read
The $85,000 flood-line question: why one Brisbane street can beat the suburb next door
A Brisbane mother discovers why two homes only streets apart can carry an $85,000 value gap when flood resilience changes the exact-address maths.
The question
“Why would anyone pay more for a house in a flood-prone suburb?”
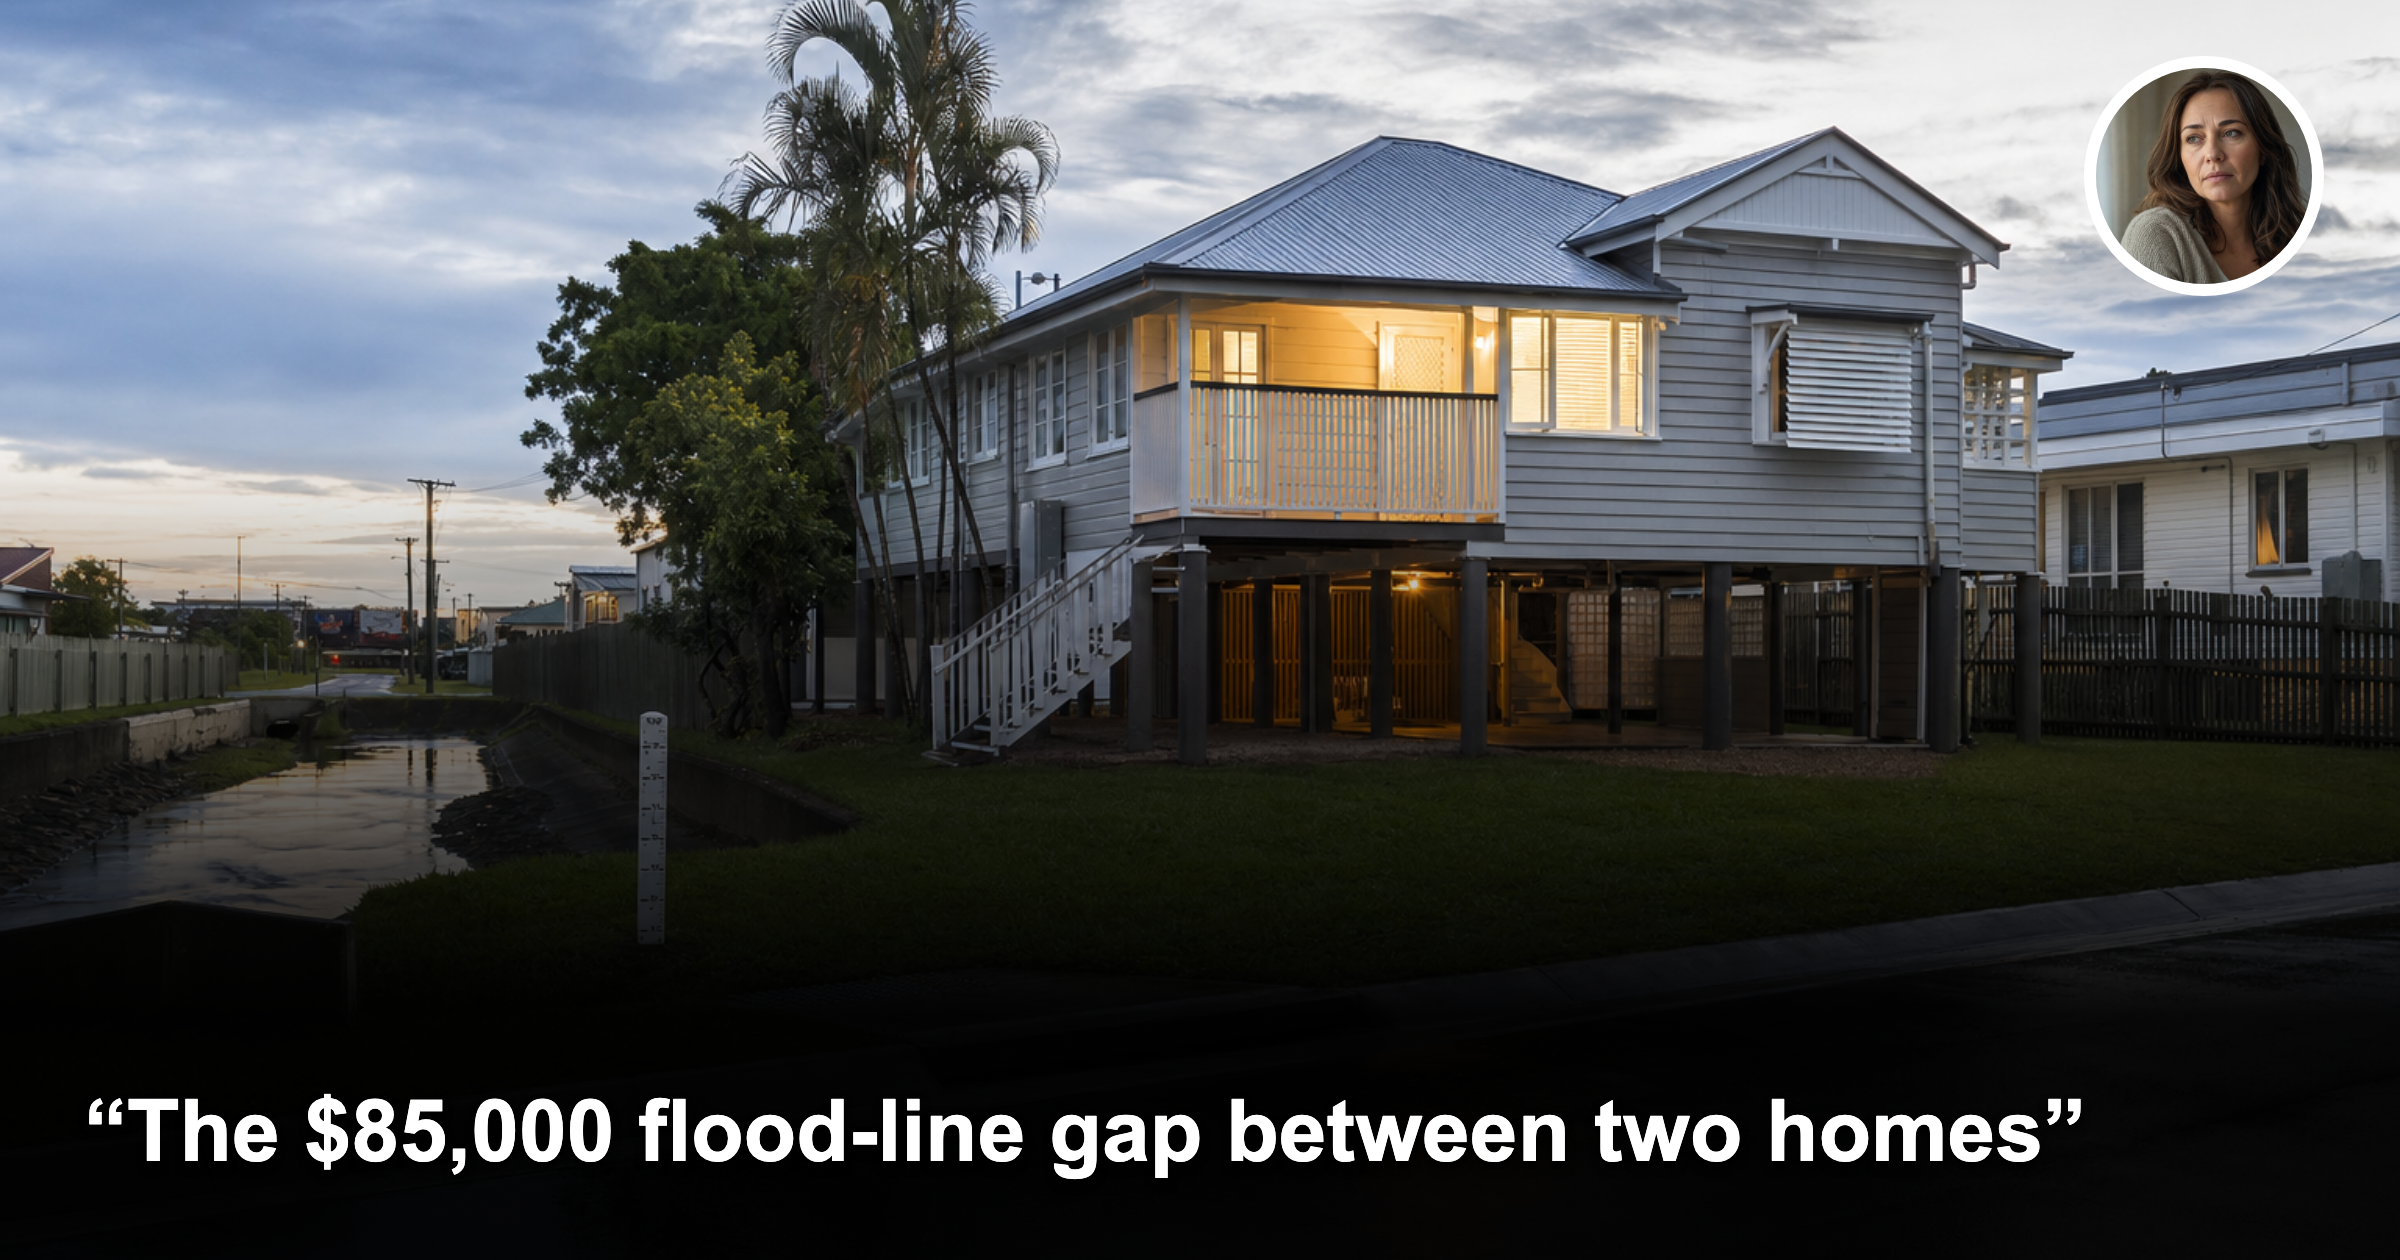
That was the question a recently divorced Brisbane mother asked after comparing two homes only a few streets apart. One was cheaper, larger and apparently ready to rent. The other sat higher, had a practical undercroft and a long history of coping with wet seasons. The difference between the two asking prices was $85,000.
Her first instinct was that the cheaper property was the obvious opportunity. The suburb had the same postcode, similar access to shops and comparable public transport. On a suburb-level dashboard, the two addresses looked almost interchangeable.
They were not.
Why this keeps catching buyers out
Flood risk is not a suburb-wide switch. It can change with elevation, drainage paths, the shape of the block, the finished floor level and what has happened to the house during previous events. Two properties can share a street name while sitting on opposite sides of a meaningful water-flow line.
That matters because buyers, insurers and tenants do not price a property from the postcode alone. They price the specific structure, the likely disruption and the evidence available when the next buyer asks the same questions.
Recent Brisbane coverage illustrated the point dramatically: a Rocklea home raised on stilts and described as “floodproof” drew a bidding contest and sold in eight days. That does not mean every elevated house is safe, or that a fast sale proves a permanent premium. It does show why the physical characteristics of one asset can overpower a broad suburb label.
The same principle applies to trees close to foundations, low points in a cul-de-sac, retaining walls, aircraft paths and busy connector roads. The street-level feature is often more important than the suburb average.
The answer: test the address, not the postcode
The $85,000 gap should not be treated as a bargain until four questions are answered.
First, what is the actual hazard exposure? A flood overlay is a starting point, not a conclusion. Check the mapped risk, the site level, floor levels, overland-flow paths, drainage and the property’s documented history. A home that has been modified may perform differently from an untouched neighbouring home, but the modification needs to be verified rather than assumed.
Second, what does insurance look like for this exact building? Premiums, exclusions, excesses and acceptance can differ according to the structure and history. A cheaper purchase can lose its advantage if annual holding costs rise or if a future buyer struggles to obtain cover. This is a due-diligence question before signing, not a spreadsheet adjustment after settlement.
Third, how did comparable properties actually trade? The relevant comparison is not the suburb median. It is the group of homes with similar elevation, access, construction, parking, flood history and usable living area. Look at achieved prices and days on market, then separate renovated, elevated and compromised stock instead of blending them together.
Fourth, who is likely to rent or buy it later? A tenant may accept a lower rent for a larger home, but vacancy and applicant depth can change sharply after a flood event or an insurance shock. An investor needs to test achieved rent, vacancy, days on market and the likely resale audience at the exact address.
What Ripehouse Advisory looks for
This is where street-level data earns its keep. Ripehouse Advisory’s research process compares the property with the streets around it using achieved sales, buyer depth, days on market, achieved rents, vacancy and the local supply pipeline. It also checks the physical factors that a suburb summary hides.
In practical terms, the question is not “Is Rocklea good or bad?” It is “Does this particular side of this particular street have the access, elevation, resilience and buyer depth that support the price?” A heatmap can reveal a pocket where elevated homes consistently attract more enquiry, while a nearby low point takes longer to sell. It can also expose the opposite: a premium that looks justified in photos but is not supported by repeat transactions.
That distinction prevents two common mistakes. The first is rejecting every property in a risk-labelled suburb and missing an asset with strong physical and market evidence. The second is buying the cheapest home because the discount feels like instant equity, without pricing the cost of insurance, disruption and resale friction.
The practical decision
For the Brisbane mother, the answer was not to pay the extra $85,000 automatically. It was to make the premium prove itself. The higher home needed clear records, a workable insurance position, comparable sales and enough rental demand to justify the additional capital. The cheaper home needed a discount large enough to compensate for its specific risk, not simply its suburb reputation.
That is the broader lesson. A risk map is an invitation to investigate, not a verdict. Some of the best property opportunities sit in areas that headlines flatten into one category. The advantage comes from identifying the right asset on the right street, measuring the risk honestly and buying with evidence.
If you are comparing investment markets, download the Top Five Investment Markets report from Ripehouse Advisory. For a property-specific discussion, use the Ripehouse Advisory discovery call page and bring the exact address. The strongest property investment decisions are built from the street outward — not from a suburb average inward.
Read the latest Ripehouse Advisory property research and see how street-level market evidence changes an investment decision.
If there's a specific street you're weighing up right now, check its Street Score first — it's free, takes ten seconds, and tells you whether that street is pulling the suburb average up or riding on it.
Market data & R-Scores for locations in this article
Drill Down Into the Markets Mentioned Above
Inspect live monthly R-Scores, median prices, rental yields, and street-by-street scores for the cities and council areas referenced in this article:
Frequently asked questions
Why can two Brisbane homes only a few streets apart be valued so differently?
Because flood risk is not decided by the suburb alone. Elevation, drainage paths, block shape, finished floor level and past flood history can make one exact address much more exposed than another nearby home.
What should a buyer check before treating a cheaper flood-prone property as a bargain?
They should test the exact address, not the postcode. The article says to check mapped flood risk, site level, floor levels, overland-flow paths, drainage and the property’s documented history.
How does insurance affect the real cost of buying a home in a flood-risk area in Brisbane?
Insurance can change by the specific building and its history, including premiums, exclusions, excesses and whether cover is even available. A lower purchase price can be offset if holding costs rise or if future buyers struggle to insure the property.
What is the best way to compare a flood-affected house with other properties?
The article says to compare it with homes that have similar elevation, access, construction, parking, flood history and usable living area. Suburb medians are too broad; achieved prices and days on market for comparable stock matter more.
What is the main risk of buying the cheapest house in a flood-prone Brisbane street?
The discount may not be large enough to cover insurance, disruption and resale friction. A cheaper home can lose its advantage if its risk profile makes it harder to hold, rent or sell later.
General information only. It does not take your objectives, financial situation or needs into account, and nothing here is legal, financial, taxation or investment advice specific to your circumstances.