Market Analysis · 2 April 2025 · 3 min read
April Market Update: Where We’re Buying—and What the Numbers Are Telling Us
Explore the latest property market trends with Ripehouse Advisory, including capital and rental growth insights, where investors are buying now, and the key metrics shaping smarter investment decisions in 2025.
We’ve seen some notable shifts across the Australian property landscape in recent months. As always, we’re closely tracking where the data is pointing and where our clients are actively buying.
In this update, we’ll break down what we’re seeing across the capital and rental growth markets, where we’re focusing our acquisitions right now, and highlight one of the standout regions getting consistent attention from both our clients and our team.
Capital Growth: Steady Overall, but Momentum Is Starting to Shift
Nationally, capital city markets have delivered 7.1% growth over the past 12 months. That’s a solid return, but we’re now seeing signs of softening in a few key locations.
Here’s how things are tracking:
- Sydney has been relatively stable, with around 5% annual growth.
- Melbourne has been flat and has slipped slightly, down 1.1% since last month.
- Brisbane, Perth and Adelaide have been the strongest performers over the past year, though some early indicators suggest they may be starting to cool.
- Hobart, after an extended period of slowing down, has seen a small lift of 1.2%, which could signal the start of a recovery.
While the national trend looks relatively balanced, the real insights are in how each market is moving beneath the surface.
Rental Growth: Consistent Returns in the Right Areas
Rental demand remains strong in several markets, and yields are holding up well in many of the areas we’ve been active in.
- The national rental growth average sits at 5.8%.
- Capital city markets are averaging 2.6%.
- Perth, Adelaide and Hobart have all delivered rental growth above 5% over the past 12 months.
- Canberra has pulled back slightly but remains relatively steady overall.
These rental figures are an important piece of the puzzle, especially in markets where capital growth may be slowing. Strong tenant demand and rising rents continue to support investor returns.
Where We're Buying Now: Victoria Leading the Way
The most noticeable trend in our recent activity has been the clear shift toward Victoria. Over the past 60 days, more than 60% of the properties we’ve purchased for clients have been in that one state.
This is a significant increase and reflects where value and opportunity are aligning right now.
So why Victoria?
- Affordability is playing a big role, especially as some markets interstate become less accessible.
- Yields are competitive and growth potential is still on the table.
- Many of our clients are also looking to diversify away from states like Queensland and WA, where they may already have multiple properties.
It’s important to point out that this isn’t a top-down decision. Clients come to us with their own goals, budgets and preferences, and we work within that brief. The shift toward Victoria is largely driven by where the best matches are right now.
Breakdown of our recent purchase activity:
- Victoria: 60%
- Queensland: 15% (down from earlier levels due to pricing pressures)
- NSW, WA and Tasmania: around 8 to 9% each
The drop in Queensland is especially telling. We’re seeing fewer properties pass our due diligence process, particularly when it comes to price. It’s getting harder to find assets there that represent fair value.
Spotlight: Latrobe Valley and National Purchase Insights
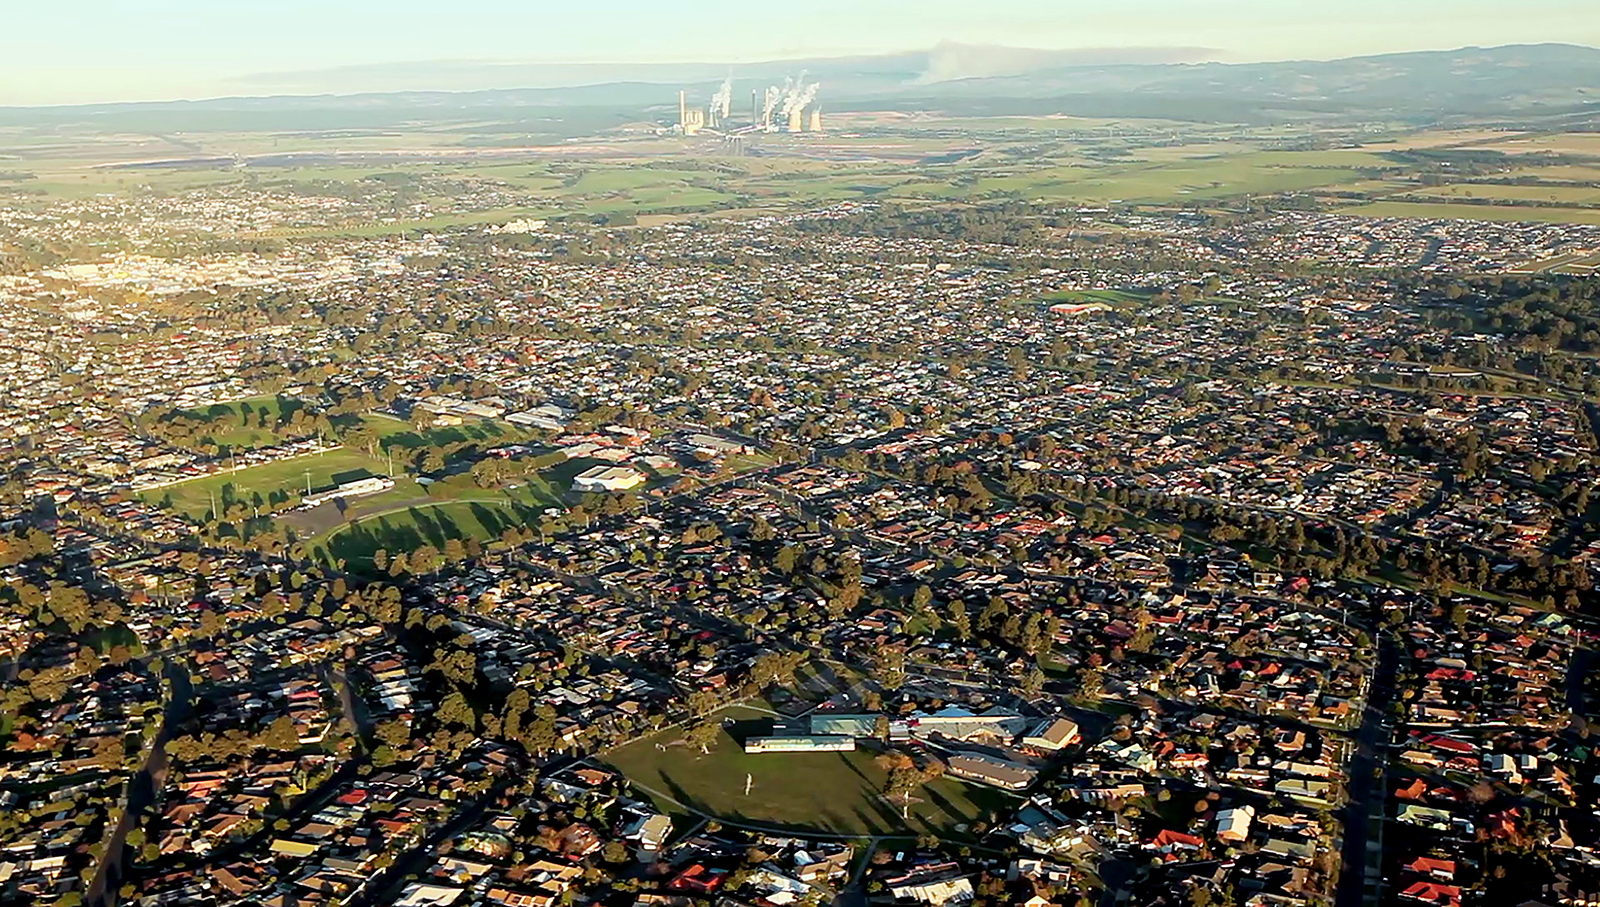
One region that’s stood out recently is the Latrobe Valley in Victoria’s Gippsland region. Around 30% of all purchases we’ve made over the past 60 days have been in this LGA alone.
While we keep most of our active locations reserved for clients, this is one area we’re happy to highlight. It offers an attractive mix of affordability, rental demand and long-term growth potential.
Looking at all our purchases across the country over the past 60 days, here are some key stats:
- Median purchase price: $546,000
- Median yield: 5%
- Average land size: 664 square metres
- Average build year: 1981
These numbers give a good sense of the types of properties we’re targeting. Established homes in growth-aligned areas, with strong fundamentals and land content that supports long-term performance.
Final Thoughts
We’re still seeing consistent results in the current market, but the pace and pattern of growth are shifting. The best opportunities aren’t always in the headlines. They’re in the data, the details and the due diligence.
Right now, we’re focusing on quality assets in locations where the numbers line up with long-term fundamentals. If you’re thinking about your next step, or want to make sure your current portfolio is still aligned with market conditions, we’re here to help.
If you’re weighing whether Victoria’s value is real or just a short-term rotation, the webinar offers a practical way to unpack the data, compare the trade-offs and see how these purchase patterns are being judged.
Frequently asked questions
Which Australian property markets are showing the strongest capital growth right now?
Over the past 12 months, Brisbane, Perth and Adelaide have been the strongest capital growth markets. National capital city growth is 7.1%, while Sydney has been relatively stable and Melbourne has been flat.
Is rental growth still strong in Australian property markets?
Yes, rental demand remains strong in several areas. The national rental growth average is 5.8%, with Perth, Adelaide and Hobart all delivering rental growth above 5% over the past 12 months.
Why is Victoria getting most of the buying attention in this market update?
Victoria has become the main focus because affordability is better, yields are competitive and growth potential is still there. Over the past 60 days, more than 60% of the properties purchased for clients were in Victoria.
Why has Queensland seen fewer purchases recently?
Queensland has dropped to about 15% of recent purchase activity because pricing pressures are making it harder to find assets that represent fair value. The article says fewer properties are passing due diligence on price.
What kind of properties are being targeted in this market?
The recent purchases have mostly been established homes in growth-aligned areas with solid fundamentals and land content. Across the past 60 days, the median purchase price was $546,000, the median yield was 5%, and the average land size was 664 square metres.
General information only. It does not take your objectives, financial situation or needs into account, and nothing here is legal, financial, taxation or investment advice specific to your circumstances.