News · 1 September 2026 · 5 min read
Where the market is actually buying: sold-price deciles, R-Score and the LGA shortlist
A weekly investor read of median sold-price deciles, mean published R-Scores and the leading LGA in each price band.
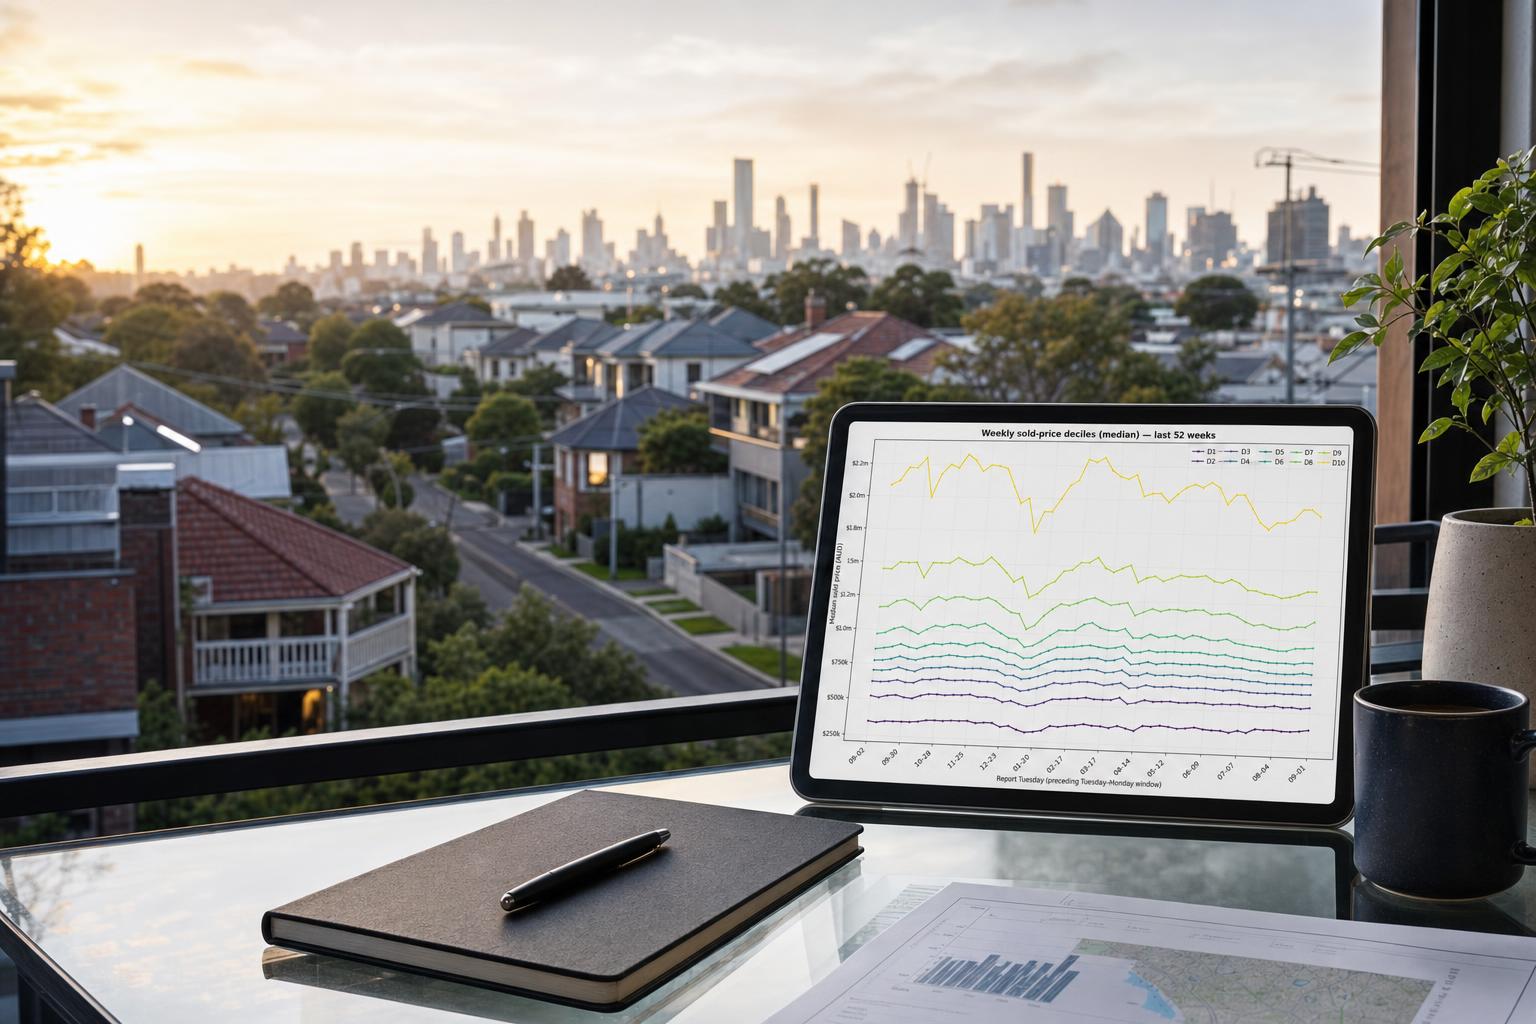
The market did not move as one market this week. Across 2,317 settled sales, the price ladder tells us what buyers actually paid; the location scores tell us whether the markets inside each band are improving, holding or losing quality. That distinction matters to an investor: a rising median can reflect a changing mix of properties, while a stable or improving R-Score points to the underlying suburb selection.
This report is designed as a screening instrument for the next property decision—not a prediction for every home. Start with the price band, test the quality signal, then investigate the exact suburb, street, property and cash flow.
1. Weekly sold-price deciles — last 52 weeks
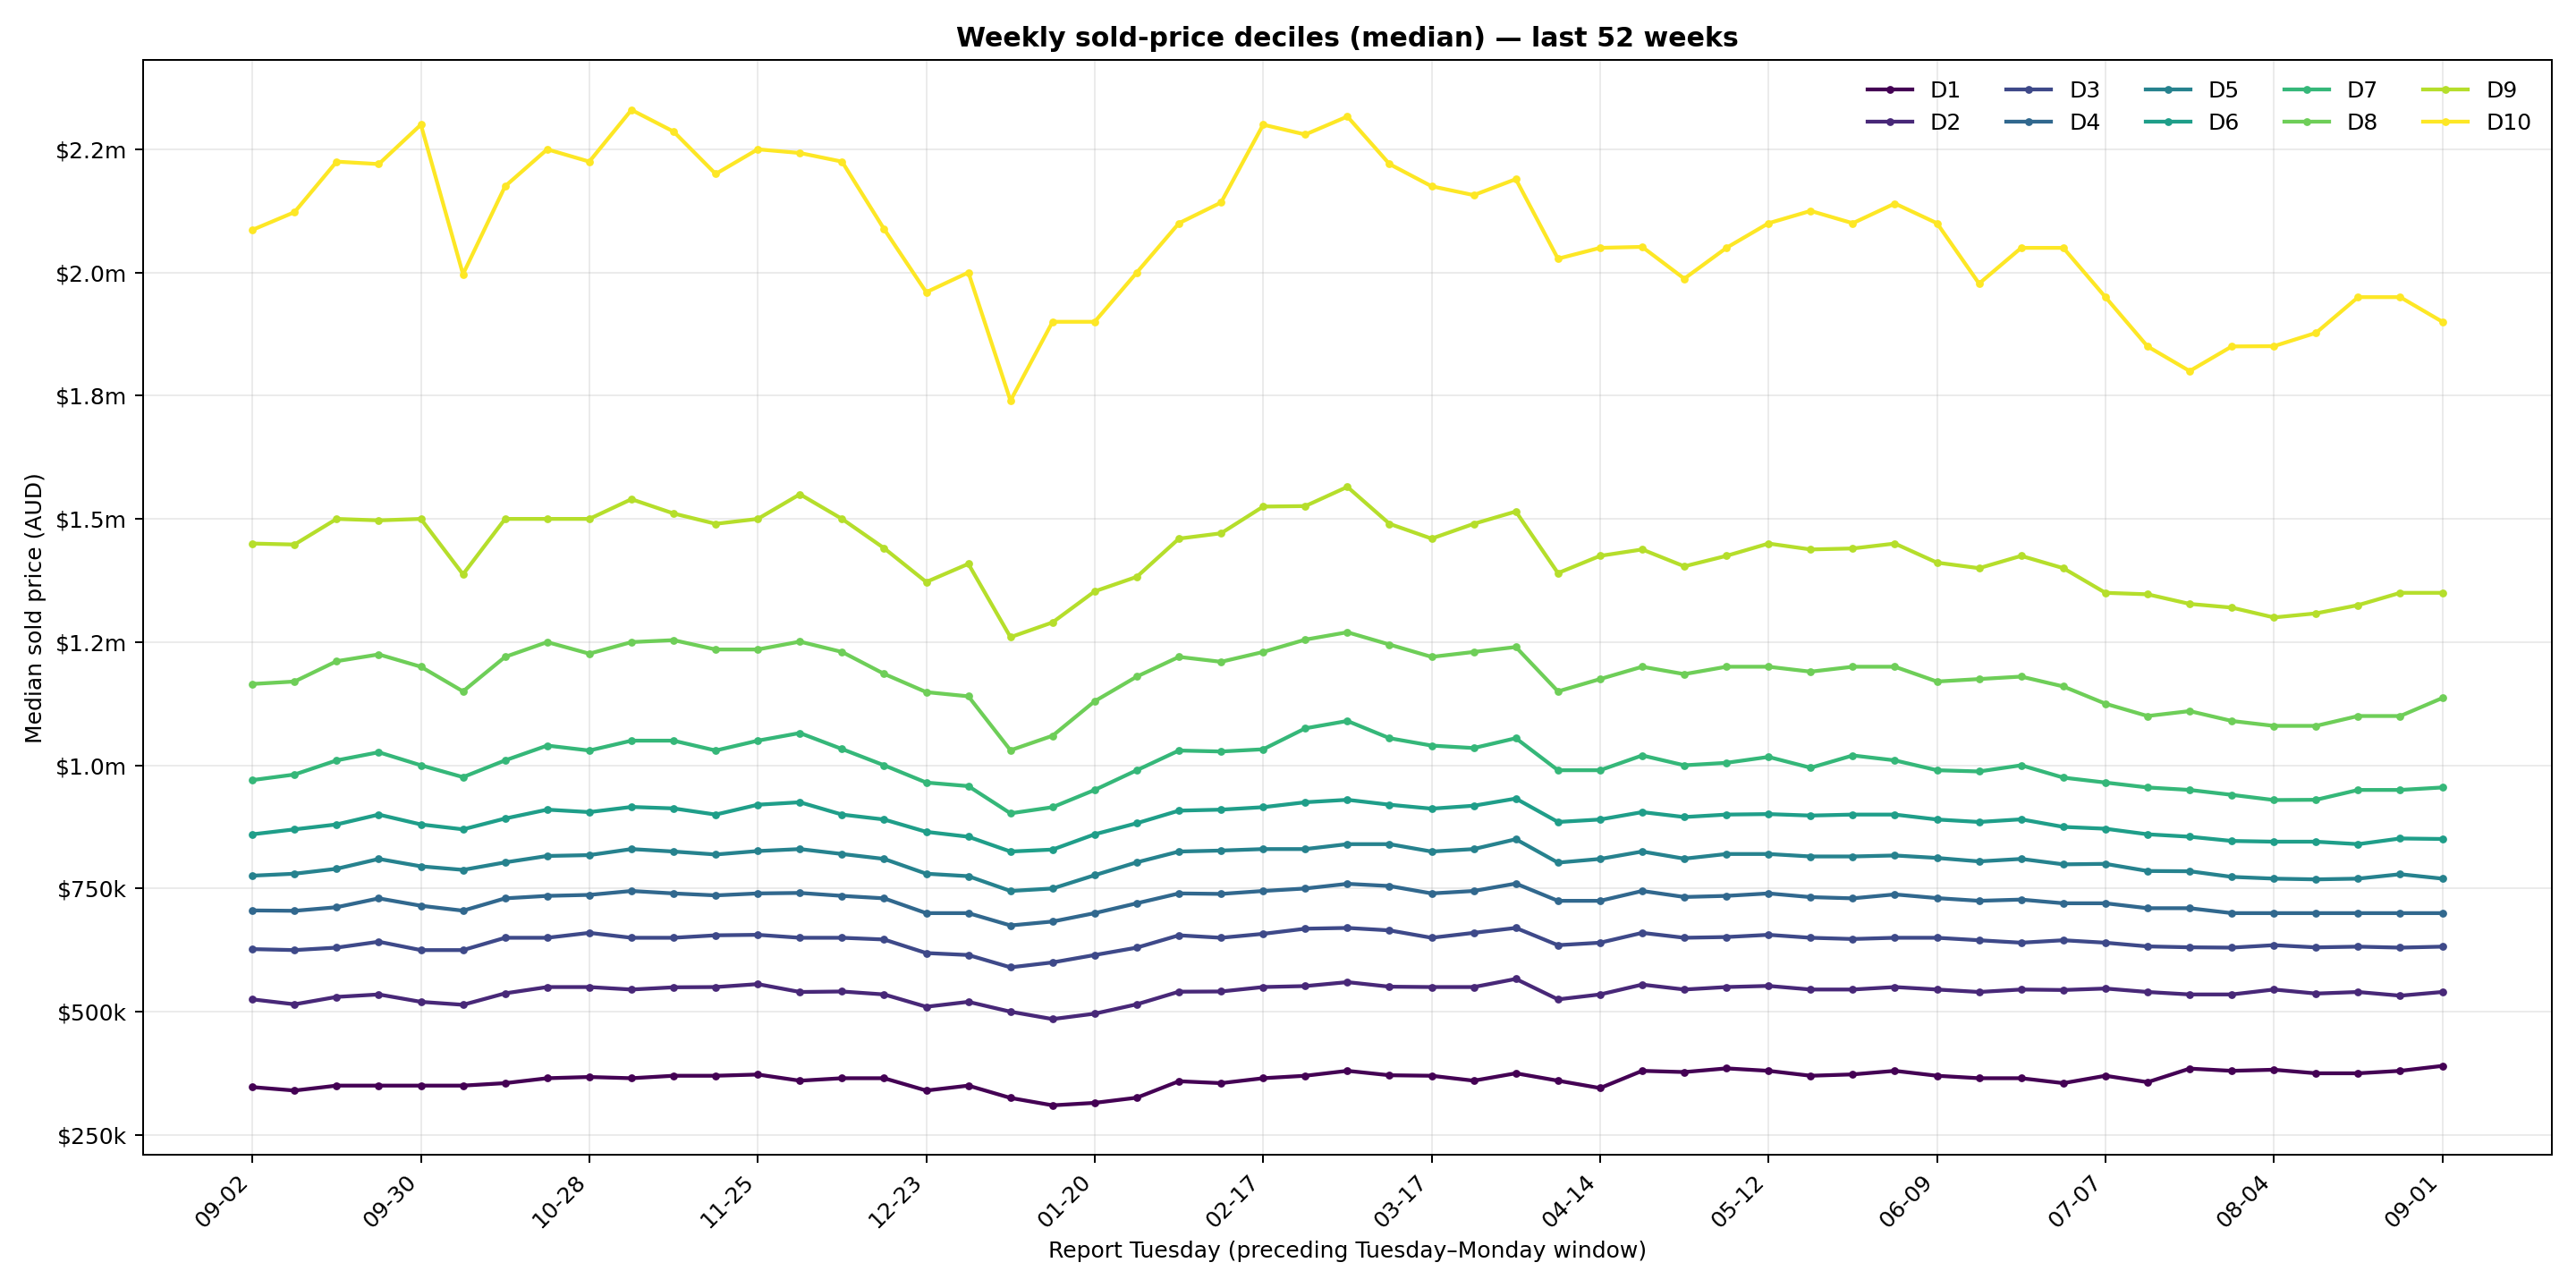
The median is the cleanest read of the transaction market because it limits the effect of unusually expensive or unusual sales. The chart tracks ten equally ranked price bands across the latest 52 weekly windows. The latest week covers 25–31 August 2026.
Median sold-price change — current versus four weeks ago
The four-week table makes the latest move easier to read than a single line. The spread matters: some price bands have strengthened while others have softened. That is useful for an investor because it shows where buyer demand is showing up, but it does not tell you whether a particular property is fairly priced.
| Decile | Current median | 4 weeks ago | Raw delta |
|---|---|---|---|
| D1 | $390,000 | $382,250 | +2.03% |
| D2 | $540,000 | $545,000 | -0.92% |
| D3 | $632,000 | $635,000 | -0.47% |
| D4 | $700,000 | $700,000 | +0.00% |
| D5 | $770,000 | $770,000 | +0.00% |
| D6 | $850,500 | $845,000 | +0.65% |
| D7 | $955,000 | $929,500 | +2.74% |
| D8 | $1,136,500 | $1,080,000 | +5.23% |
| D9 | $1,350,000 | $1,300,000 | +3.85% |
| D10 | $1,900,000 | $1,850,500 | +2.67% |
What it means for property investors
Use the four-week move to decide where to look, not what to buy. A price band that is firming while its R-Score is stable or improving deserves a closer suburb-level review. A band that rises only because the sales mix changes needs more caution. The decile is a map of market behaviour; it is not a valuation of an individual property.
2. Mean current R-Score by sold-price decile
For each sale, we matched the suburb and state to the latest published 0–100 R-Score and averaged those matched values inside the relevant sold-price decile. The current snapshot is 31 July 2026. The week-over-week delta compares with 18–24 August.
| Decile | Mean R-Score | Prior week | WoW delta |
|---|---|---|---|
| D1 | 77.05 | 75.57 | +1.49 |
| D2 | 78.81 | 77.69 | +1.12 |
| D3 | 79.52 | 78.11 | +1.41 |
| D4 | 76.48 | 76.86 | -0.38 |
| D5 | 78.15 | 76.24 | +1.91 |
| D6 | 75.59 | 76.80 | -1.21 |
| D7 | 77.47 | 78.12 | -0.65 |
| D8 | 79.21 | 79.00 | +0.22 |
| D9 | 79.54 | 79.42 | +0.11 |
| D10 | 79.55 | 80.79 | -1.24 |
What it means for property investors
The R-Score adds a location-quality lens to the price distribution. It can help identify whether a lower price band is offering access to stronger-scoring suburbs, or whether a higher band is paying more without a corresponding quality advantage. Because this is an average of suburb scores attached to sales, it should narrow the search—not replace suburb and property due diligence.
3. Top LGA in each sold-price decile
Within each current price decile, the table below identifies the LGA with the most sales in the latest week. It adds scale, population, the LGA/decile median sold price, a simple gross-yield proxy and the highest-scoring suburb identified within that leading LGA. The suburb name links to its suburb intelligence page.
| Decile | Leading LGA | State | Population | Sales | Median sold price | Gross yield proxy | Mean R-Score |
|---|---|---|---|---|---|---|---|
| D1 | Capel (S) | WA | 20,171 | 15 | $415,000 | 9.48% | 77.67 |
| Top Suburb (By R-Score): Boyanup | |||||||
| D2 | Wyndham (C) | VIC | 347,830 | 16 | $545,000 | 5.04% | 78.18 |
| Top Suburb (By R-Score): Tarneit | |||||||
| D3 | Wyndham (C) | VIC | 347,830 | 25 | $630,000 | 4.36% | 80.02 |
| Top Suburb (By R-Score): Tarneit | |||||||
| D4 | Wyndham (C) | VIC | 347,830 | 18 | $691,000 | 3.98% | 76.25 |
| Top Suburb (By R-Score): Tarneit | |||||||
| D5 | Casey (C) | VIC | 414,929 | 12 | $778,750 | 4.18% | 77.66 |
| Top Suburb (By R-Score): Cranbourne South | |||||||
| D6 | Moreton Bay (R) | QLD | 532,445 | 12 | $880,000 | 4.15% | 76.83 |
| Top Suburb (By R-Score): Empire Bay | |||||||
| D7 | Brisbane (C) | QLD | 1,375,301 | 13 | $960,000 | 4.30% | 78.93 |
| Top Suburb (By R-Score): Cashmere | |||||||
| D8 | Blacktown (C) | NSW | 449,385 | 15 | $1,116,000 | 3.32% | 79.88 |
| Top Suburb (By R-Score): Stanhope Gardens | |||||||
| D9 | Brisbane (C) | QLD | 1,375,301 | 17 | $1,300,000 | 3.18% | 79.68 |
| Top Suburb (By R-Score): McDowall | |||||||
| D10 | The Hills Shire (A) | NSW | 222,675 | 22 | $1,875,000 | 2.40% | 80.18 |
| Top Suburb (By R-Score): Annangrove | |||||||
Yield proxy = mean advertised weekly rent in the LGA × 52 ÷ the median sold price for that LGA within the decile. It is not property-matched and excludes vacancy, ownership costs, finance, tax and capital expenditure. Population is the latest available ABS figure. A top suburb by R-Score is a screening lead, not a recommendation.
What this means for the next decision
These tables are useful because they narrow an otherwise national search: price shows the entry band, R-Score adds a quality lens, and the LGA/suburb view gives you a place to start. They still cannot answer the question that matters most: should you buy this property, in this suburb, at this price, for your position?
That is the purpose of an Investor Decision Review. In a short, no-obligation session, the data can be tested against your borrowing capacity, investment horizon, cash-flow tolerance and the exact property risks. The outcome may be “look closer”, “wait”, or “do not buy”—the value is turning a broad market signal into a disciplined next decision.
Method: sold records are sorted by price into ten contiguous rank deciles in each seven-day window. R-Score values are the arithmetic mean of matched published 0–100 r_perc suburb scores; unmatched sales are excluded from that mean. Results are screening signals and general information only, not personal financial advice or individual-property forecasts.
If there's a specific street you're weighing up right now, check its Street Score first — it's free, takes ten seconds, and tells you whether that street is pulling the suburb average up or riding on it.
Market data & R-Scores for locations in this article
Drill Down Into the Markets Mentioned Above
Inspect live monthly R-Scores, median prices, rental yields, and street-by-street scores for the cities and council areas referenced in this article:
Frequently asked questions
What does this weekly sold-price decile report actually tell an investor?
It shows where buyers actually paid across ten price bands, then layers in suburb quality using mean R-Score and the leading LGA in each band. That helps narrow the search to a price range and location set worth checking further, rather than treating the whole market as one story.
Why does the report use the median sold price instead of the average?
The median is used because it limits the influence of unusually expensive or unusual sales. That makes it a cleaner read of the transaction market, but it still does not value any individual property.
How should I read the R-Score next to each price decile?
The R-Score adds a location-quality lens by averaging matched published suburb scores within each sold-price band. It can show whether a lower price band is giving access to stronger-scoring suburbs, but it should narrow your search rather than replace suburb and property due diligence.
What is the main risk in using these tables to choose a property?
A rising median can reflect a change in the mix of properties sold, not necessarily stronger underlying demand. The report also makes clear that the figures are screening signals only, so they cannot tell you whether a specific property is fairly priced or right for your situation.
What should I do after finding a price band, LGA or suburb that looks interesting?
The report suggests moving from the broad signal to a closer review of the exact suburb, street, property and cash flow. It also says the final decision should be tested against borrowing capacity, investment horizon, cash-flow tolerance and the property’s specific risks.
General information only. It does not take your objectives, financial situation or needs into account, and nothing here is legal, financial, taxation or investment advice specific to your circumstances.