Market Intel · 9 October 2026 · 5 min read
Property Investment Maths: 3 Buyers, Costs and 12-Month Upside
Three recent property purchases reveal the real 12-month maths behind rental growth, holding costs and capital growth—and why street-level research matters more than national headlines.
▶ Watch the full video on YouTube: 5.3% Rent Growth: The 12-Month Maths Behind 3 New Buys
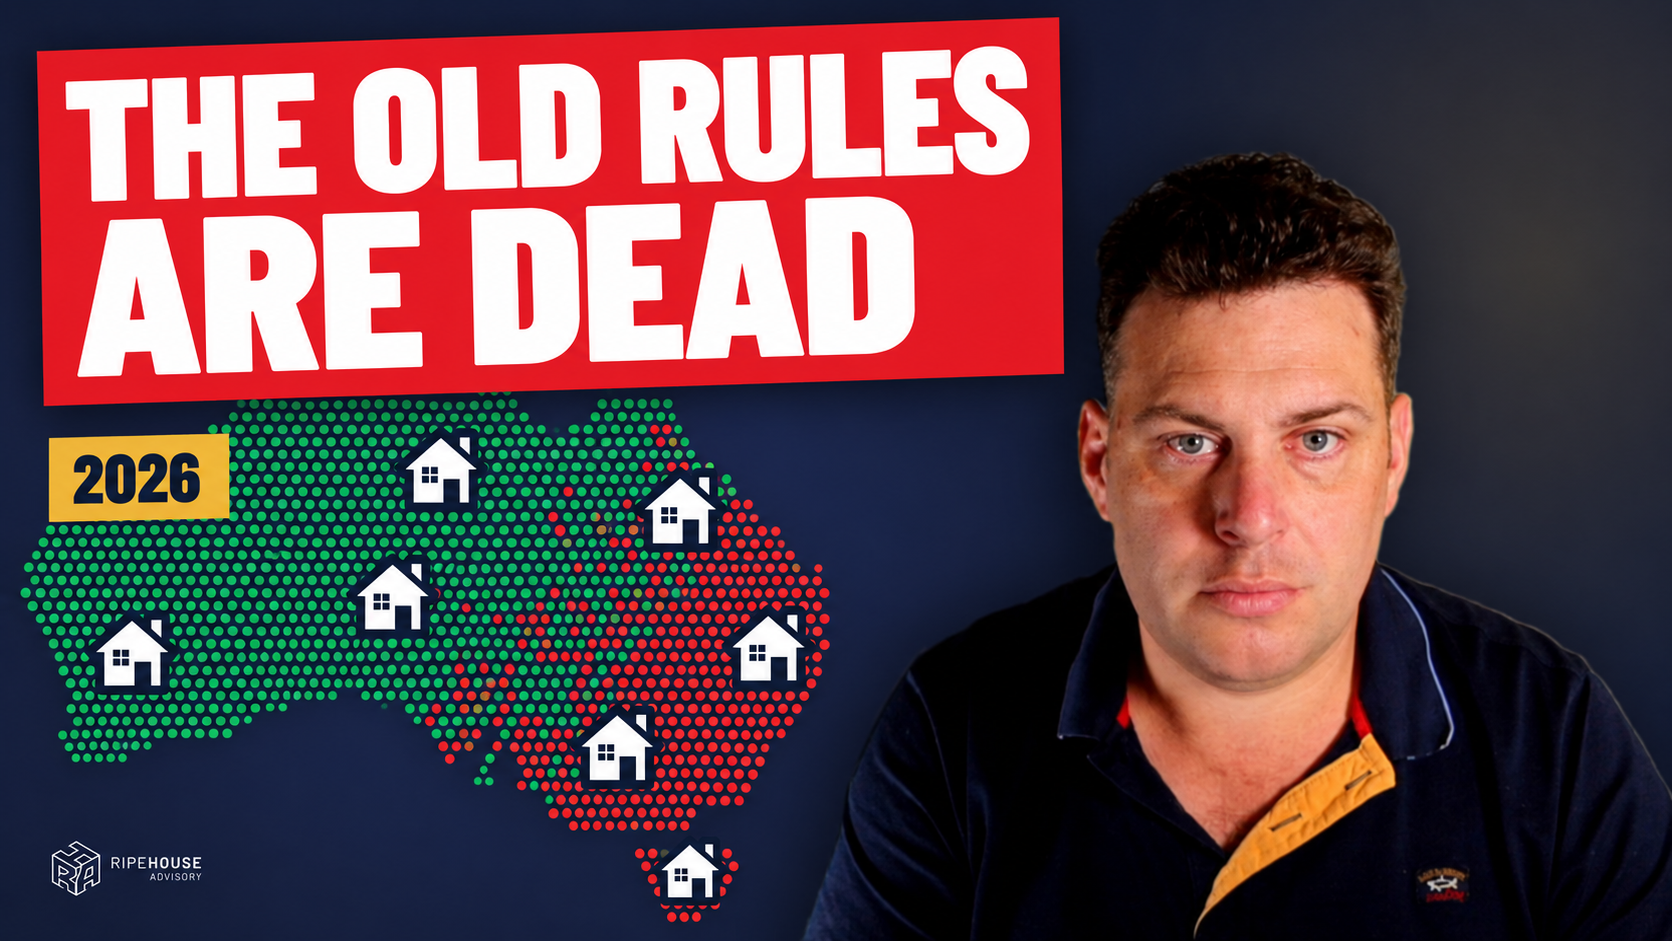
Rent is rising faster than inflation across most Australian suburbs tracked by Ripehouse Advisory, but that does not make every property a good investment. The real answer comes from combining suburb, street, property quality and holding-cost data before you buy.
Property investment maths starts with the rent
Across the 3,700-plus suburbs measured with reliable rental data, the typical rent rose 5.3% over the last year. Inflation was 4%, and rents increased in 7 out of 10 suburbs.
That matters because rent can act as an inflation hedge. As the cost of living rises, rental income may also increase, helping the asset carry more of its own weight over time.
The longer-term comparison is also notable. Since late 2021, prices across the economy have risen by about 21%. Over the same period, rents in two of the three suburbs featured in these purchases rose 29% and 44%. The third rose about 19%, which is slightly behind the broader price increase.
This is not a reason to buy any property with a rising rent. It is a reason to examine rental growth, vacancy and tenant demand at a much more local level.
Lower price bands are leading value growth
National property headlines tend to focus on one average number. Ripehouse Advisory separates more than 4,100 suburbs with reliable sold data into 10 price bands, from the cheapest to the most expensive.
The results show a clear split:
- In the cheapest bands, under around $620,000, typical values rose 15% to 17% over the last 12 months.
- In the middle price bands, values rose around 13% to 18%.
- In the most expensive 10%, above about $1.7 million, values fell almost 4%.
All three purchases in this case study sit in the bottom two price bands. The broader economy sets the average, but the street and property determine the result you actually experience.
Buyer one: an experienced investor who needed structure
Sam is a health professional who has invested since about 2000. When his family needed a bigger home, he sold two investment properties to reduce the home loan. Later, uncertainty about interest rates and the broader market caused him to freeze.
His problem was not a lack of income or experience. It was a lack of structure for deciding whether a property was worth buying. Suburb-level data was not enough; the answer was often at street level. He also recognised that holding everything in one city created its own concentration risk.
Sam had an offer accepted on a house in a regional city for $600,000. The town has an R-Score of 91 out of 100, rents are climbing and the purchase price was below the typical sales price.
Using the same comparison model applied to all three properties, the property produces $27,000 in rent over 50 weeks. Interest, management, rates, water, insurance and repairs total about $41,900, leaving a pre-tax holding shortfall of about $14,900, or roughly $286 a week.
At the modelled 12% capital growth assumption, the property would be worth $72,000 more after a year. Subtracting the holding shortfall leaves an illustrative position of about $57,000 ahead. The weekly rent would also rise from $540 to about $572 by month 12 under the model.
Buyer two: a busy professional building from a strong income
Josh is also a medical professional earning well on a single income, but he did not yet own much property. His concern was that his net worth was not keeping pace with his salary. His goal was to build a portfolio that could eventually provide an income.
He had signed up more than a year earlier, but a busy life caused the search to stall. The solution was a reset: a clear budget, a minimum rental yield of 4.5%, and a requirement not to buy in the state where he already owned property.
Within about a week, Josh had an offer accepted on a house in the low $600,000s. Annual rent had risen almost 13%, vacancy was under 2%, and he paid below the suburb’s typical sale price.
On the same comparison basis, Josh is about $62,000 ahead after 12 months, with an estimated holding cost of about $250 a week. The model assumes an 80% loan at 7.25% interest only, deliberately above the average investor rate used in the comparison.
Buyer three: buying carefully with cash
Ray and Carol bought inside their super fund using cash, with no loan. Their brief was deliberately specific: a brick or newer home, minimal maintenance and no asbestos. They walked away from properties with rising damp, defects and rooms that were too small.
The search took a few months. That was acceptable because buying a problem simply because you are tired of looking can be more expensive than waiting for the right property.
They eventually bought a renovated home that came to Ripehouse Advisory off-market, signing in the mid $500,000s. The town’s R-Score was lower than Sam’s, but that was not the reason they bought. The decision was based on the property’s condition, a price below the town’s typical sale price and the rental income.
On the standard 80% loan comparison, the property is about $51,000 ahead after 12 months. In reality, because Ray and Carol paid cash, the rent puts them about $17,000 in front before tax, plus any capital growth.
The Ripehouse Advisory take
These three purchases show why property investment maths needs to be personal and property-specific. The same asset class can suit an experienced investor rebuilding confidence, a busy professional starting a portfolio or a cautious cash buyer seeking a low-stress, rent-ready property.
The common process was to assess the region, suburb, street and individual house. Each buyer rejected properties before finding one that met the brief. That sequence matters: a strong town with a poor street can still produce a poor purchase.
The numbers also need to be carried honestly. If values did not move for a year, each buyer would be about $13,000 to $15,000 behind under the comparison model. A full one percentage-point increase in interest rates would add about $5,000 to the annual cost. The right property is one you can carry through that scenario, not just one that looks attractive when growth is assumed.
The Ripehouse Advisory approach is to use data, a clear brief and street-level research to decide whether the timing and property are right for you. Download our no-cost Top Five Markets Report 2026 → https://ripe.house/five-markets
General information only. It does not take your objectives, financial situation or needs into account, and nothing here is legal, financial, taxation or investment advice specific to your circumstances.