News · 13 August 2026 · 5 min read
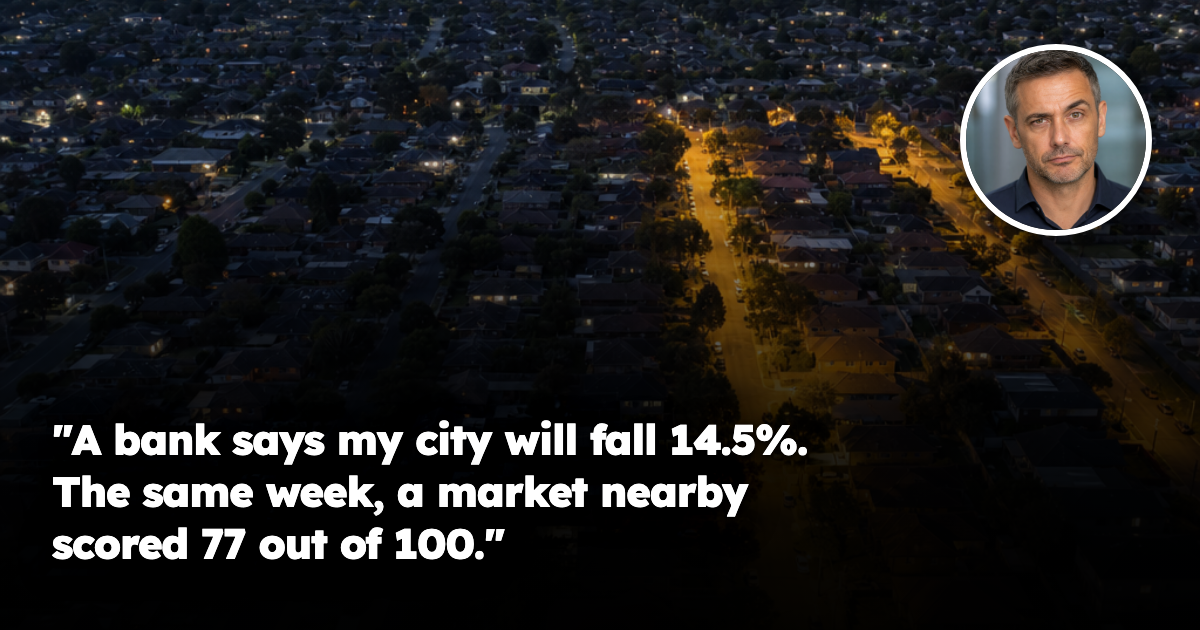
A bank says my city will fall 14.5%. The same week, a market two suburbs away scored 77 out of 100
A major bank has downgraded its house price forecast to a double-digit national fall. In the same quarter, the country's worst-performing jurisdiction also contained one of its ten hottest markets. An investor asked us which number applies to the house he actually owns. That question has a real answer.
We get asked this every time the forecasts get revised, and this month it arrived with unusual
force — because for once the person asking had done the reading.
He is 46, owns his home and two investment properties, and has held all three long enough to have
seen a cycle turn before. He is not panicking and he is not selling. He described himself as
"annoyed at being told two opposite things by people who are both good at their jobs."
In a few days he read that a major bank had downgraded its forecast to a total
peak-to-trough fall of 10.6 per cent across the capital cities, with one capital tipped to
fall 14.5 per cent and another 12.8 per cent. Serious economists, serious institution,
properly argued position.
Then he read a separate quarterly analysis of local markets. In the same quarter, the top-scoring
market in the country rated 77 out of 100 and second place 76 — with six of the ten
hottest local government areas nationally inside one capital's metropolitan area.
His question: "Which one of those is my house?"
The number almost nobody noticed
The single most useful fact in either dataset was buried. The jurisdiction with the worst
reading in the country — only 23.4 per cent of its 278 scorable markets classified positive,
the lowest anywhere nationally — also contained one of the ten hottest markets in Australia,
scoring 72 out of 100.
Worst jurisdiction in the country. Top-ten market in the country. Same quarter. Same dataset.
That is not an error and it is not a paradox. It happens again in the direction nobody expects:
the two capitals carrying the worst headline forecasts — the 14.5 and the 12.8 — recorded **49.1
per cent and 47.3 per cent positive markets. Both above** the national average of 43.3
per cent. The cities forecast to fall hardest had better-than-average underlying breadth in the
same week.
So is the market falling or not?
Both — and that is not a fudge. Nationally the deterioration is real and fast. Positive market classifications fell from **52.1
per cent in March to 43.3 per cent in June. Declining markets went from 132 to 482** in a
single quarter — a 265 per cent increase. Monthly national values fell 0.7 per cent in
July, the largest single-month decline in more than three years.
But "the market fell 0.7 per cent" and "your property fell 0.7 per cent" are two completely
different statements, and only one is about an asset that exists. A national figure averages every
market in the country, including the ones moving the other way. Average a market scoring 77 with
one scoring 20 and you get a number that describes neither and that nobody owns. The forecast is
not wrong — it is answering a question about the aggregate. He owns three specific addresses.
What the hot markets actually had in common
The analysis that produced the 77 and the 76 was not built on price predictions at all. It was
built on supply, days on market, inventory levels and price momentum — not sentiment or
forecasts, but counts of physical things that already exist.
And what a genuinely tight market looks like is observable long before it shows up in a median:
stock clears quickly, inventory thins, days on market collapse, properties sell above asking,
vacancy disappears. None of it requires you to guess where rates go next.
This is the basis of how we research a purchase, and why our work happens at street and suburb
level rather than city level. The gap between the best and worst streets inside one suburb —
same postcode, same median, same council, same station, same school catchment — routinely runs to
a 20 to 30 per cent difference in effective yield once you use achieved rents, real vacancy
duration and real days on market rather than advertised figures.
That dispersion does not disappear in a downturn. It widens — a falling market is precisely when
buyer depth, scarcity and days on market separate good streets from average ones, because there is
no longer enough demand to lift everything at once. Automated and statutory valuation methods share
the same blind spot: they assume land within an area behaves consistently. We wrote about that when
the
valuation basis itself gets tested,
and about why two streets in one suburb can carry a 20–30% yield gap.
What we told him to do
Four steps, in order.
- Stop trying to price the forecast. He cannot influence the cash rate and neither can his
properties. A peak-to-trough estimate is an input to nothing he controls.
- Get the four live metrics for each address — stock on market, days on market, achieved
rents and vacancy duration, at street level. A measurement exercise, doable this week.
- Rank his three properties against each other. In a re-sorting market the useful question is
not "should I sell" but "if I ever sell one, which one, and why that one." Most owners have
never ranked their portfolio on anything except purchase price.
- Treat any address that fails on all four as a decision, not a disaster. Weak stock in a
weakening market is the one combination patience does not fix.
His result was instructive. Two came back with thin stock and short selling times. The third —
bought in a growth corridor where fresh releases keep arriving — came back with rising inventory
and lengthening days on market. Same owner, same city, same forecast in the newspaper.
Where this leaves an owner
The forecasts also contain the part left out of the headline. The same bank expects prices to begin
recovering through the second half of 2027 and capital city values to rise **4.3 per cent in
2028**, supported by rate cuts — and its own economists noted that given the supply backdrop and
construction capacity constraints, it is hard to see prices falling for long. The local-market
analysts put it more plainly: a cycle rotation, not a collapse.
So the read is not "property is broken." It is that the market has stopped moving as one thing.
When 43.3 per cent of markets are positive, four in ten local markets are still working and six
are not — and the difference is measurable before you buy.
That is a harder market to buy carelessly and a better one to buy carefully. The owners who
struggle over the next two years will mostly be the ones who bought a national average; the ones
who do well will be able to tell you, with numbers, what their street is doing while the country
argues about the aggregate. He was never asking the wrong question — he was asking it at the wrong
scale.
**A forecast can tell you what the country might do. It cannot tell you what your street is
already doing — and one of those two numbers is the one you own.**
*This article is general information only and does not take into account your personal
objectives, financial situation or needs. Consider obtaining professional advice before making
any investment decision.*
If there's a specific street you're weighing up right now, check its Street Score first — it's free, takes ten seconds, and tells you whether that street is pulling the suburb average up or riding on it.
Frequently asked questions
If a bank forecasts a national house price fall, does that tell me what will happen to my property in Australia?
No. The article says a national forecast describes the aggregate market, not the specific street or suburb you own. Two properties in the same city can move very differently depending on local supply, demand and selling conditions.
What local signs should I look at instead of just a city-wide forecast?
The article says to check four live metrics for each address: stock on market, days on market, achieved rents and vacancy duration. It also says to look at these at street level, because that is where real performance differences show up.
Why can one suburb or street do well when the wider state or city is weak?
Because local market conditions can differ sharply even inside the same postcode or council area. The article notes that tight stock, short selling times and strong buyer depth can exist alongside a weak headline forecast.
What is the main risk for an owner in a falling market?
The article says weak stock in a weakening market is the combination that patience does not fix. It also warns that properties failing on all four live metrics should be treated as a decision, not a disaster.
What should a property owner do first when the headlines and local data point in different directions?
The article says to stop trying to price the forecast and instead measure each property. Then rank the portfolio against itself so you can judge which address is strongest or weakest on actual local evidence.
General information only. It does not take your objectives, financial situation or needs into account, and nothing here is legal, financial, taxation or investment advice specific to your circumstances.