News · 14 August 2026 · 5 min read
'My agent says the market is strong. My house has been listed for eleven weeks. Both of those can't be true'
A vendor eleven weeks into a failed campaign couldn't understand why a rising suburb median wasn't producing offers. The answer was a free, public number she had never looked at - and it is measured street by street, not suburb by suburb.
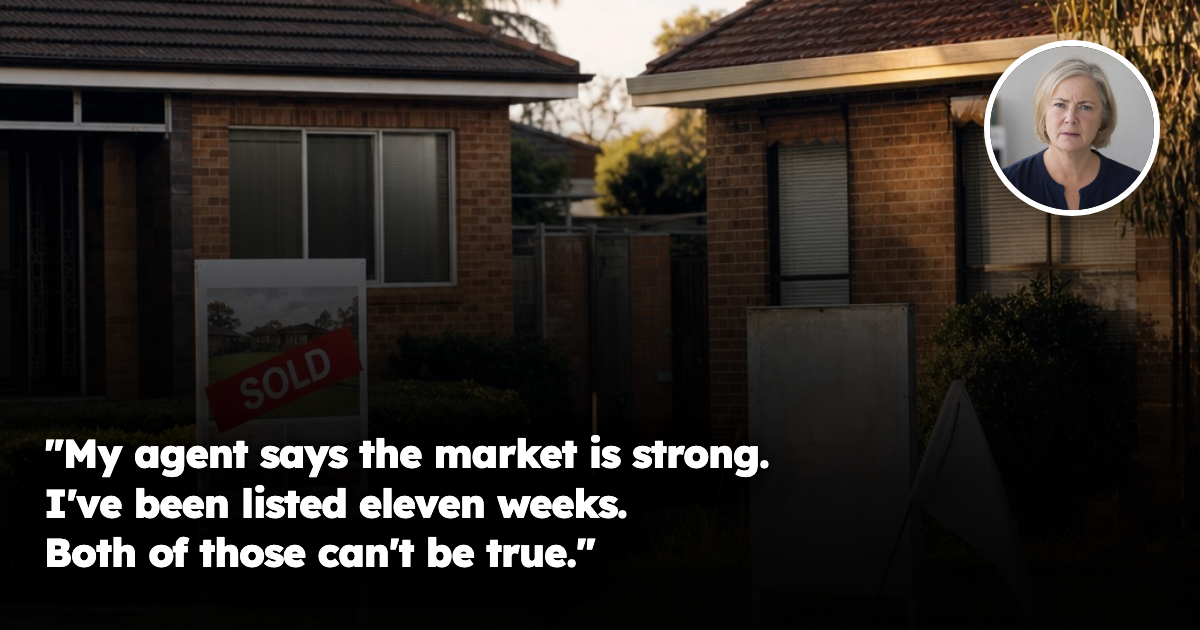
She rang us eleven weeks into a campaign, with a question rehearsed in the car.
"Every report says my suburb is up. My agent says the market is strong. So why has nobody made me an offer since the second weekend?"
She is in her late fifties, a school administrator, selling a three-bedroom house she has owned since 2011 to move closer to her daughter. She priced it on the agent's appraisal, styled it, held forty-one inspections. She is now where thousands of Australian owners are: technically in a rising market, practically unable to sell.
Both things are true. The market she read about and the market she is standing in are measured by two different numbers, and almost nobody checks the second one.
The number that was always there
Every owner knows their price. Almost none know their days on market. DOM is the number of days a property is advertised before a contract is agreed — published, free, and the most under-used number in Australian property.
What makes it different is how it is built. A median price is an average assembled downward from a suburb. An auction result is a weekend tally. A vacancy rate is a regional ratio. Days on market is the only headline metric measured on individual properties and added upward — street-level data by construction, not interpretation.
And the spread inside it is enormous. The national median time on market has averaged around 36 days over the past five years. Right now the fastest-selling suburb in the country turns over stock in 10 days — three and a half times quicker. In that suburb's own state the second-fastest market takes 17 days; the quickest suburb in the state capital takes almost double the leader's time.
10, 17 and 36 are all correct at the same moment. The only question is which describes your house.
Why speed and price are not the same story
In one capital city earlier this year, the median time to sell a house went from 9 days in February to 14 days in May — a 50 per cent increase in three months. Over the same period, in the same city, the median house price rose 2.2 per cent to $920,000, with annual growth of 16.5 per cent.
Read that again. Selling times nearly doubled while prices climbed double digits. Nothing about the housing stock changed in twelve weeks. What changed was supply: new listings ran above 1,000 a week and active listings hit 5,137, up nearly 21 per cent on the year.
So her agent isn't lying and neither is her research. Price tells you what the last comparable sale achieved. Days on market tells you how hard it was to achieve it, and how many other vendors are currently trying.
Be precise, though. A rising DOM does not mean prices are falling — it measures the supply-demand balance at a point in time, nothing more. And a long campaign is not automatically a bargain: sometimes a property has sat four months because it is overpriced, needs structural work, or is in a poor position. DOM is a prompt to investigate, never a conclusion.
Where the street-level data decides it
In that same capital city, in that same month, against a city median of 14 days: the fastest house markets sold in 6 days. Five more suburbs sat at 7 days, three at 8.
Six days versus a fourteen-day city median. Same metro, same month, same dataset, same rates, same lending rules — and the best pockets cleared in under half the time the city figure implied. That gap is not noise. It is the whole decision.
Now go one level further down, which is where we work. Two streets inside one suburb — same postcode, same median, same catchment, same station — routinely produce a 20 to 30 per cent spread in effective yield once you use achieved rents, real vacancy duration and actual days on market rather than advertised figures. One street sells in a fortnight to a queue. The street behind it takes eleven weeks and finishes with a discount.
What fast DOM measures is buyer depth times scarcity: broad demand multiplied by limited stock for sale. That is why it carries more information than either alone — and why it is not a fixed attribute you inherit with the title.
Her situation resolved in twenty minutes of data. Her suburb median was genuinely up. But her run of the street had eleven competing listings inside 400 metres — most the same era, same footprint, same three bedrooms — because a subdivision cohort built in one window had matured to where owners move on together. She wasn't competing with the market. She was competing with her neighbours, as the fourth-cheapest of eleven near-identical houses.
That is not a price problem. It is a buyer-depth-versus-competing-supply problem, invisible in every number she had been reading — a large part of why the suburb median is the wrong unit of analysis, and it behaves exactly like the dispersion that shows up in renovation returns.
What to do with this
If you are selling: find the real DOM for your street and dwelling type before you set a price — not the suburb figure, not the appraisal. Then count competing listings within walking distance. If your street's honest number is 60 days and you priced for a 14-day market, the campaign fails slowly and expensively while rates, insurance and possibly two mortgages run the whole time.
If you are buying: DOM is the cheapest read on the other side of the table. Negotiation begins not when a price is discussed but with understanding the vendor's position. A property listed well beyond its street's normal selling time tells you something about motivation no asking price will. Then establish why it sat — that reason is either your discount or your problem.
If you are holding: the ability to sell well and quickly is an asset characteristic as real as the yield — priced by almost nobody, impossible to acquire after the fact.
The part that favours investors
A market where listings are high, buyers cautious and selling times stretching is not a bad market to buy in. It is a slow one — and slow markets reward preparation over urgency.
Investor lending has just recorded its sharpest quarterly fall in years, with loan numbers down 8.6 per cent nationally and fewer than half of auctioned homes selling under the hammer. But the retreat is uneven: investor loan sizes are still rising in three states — and underneath it all sit a resilient labour market, population growth and a real shortfall in new dwellings. The dispersion punishing her — a 6-day street and a 60-day street inside one suburb — is the same dispersion that rewards a buyer who measures it before signing.
She spent eleven weeks learning her house was average for its street. The number that would have told her in an afternoon was free and public. She never looked.
If there's a specific street you're weighing up right now, check its Street Score first — it's free, takes ten seconds, and tells you whether that street is pulling the suburb average up or riding on it.
Frequently asked questions
What is days on market, and why does it matter more than the suburb median when selling a house in Australia?
Days on market, or DOM, is the number of days a property is advertised before a contract is agreed. It is useful because it measures individual properties street by street, while a suburb median is built from broader sales and can hide big differences within the same area.
Can a suburb’s median price rise even if a home takes much longer to sell?
Yes. The article shows that prices can keep rising while selling times stretch out, because price and speed measure different things. A higher median does not mean every house is attracting buyers quickly.
Why might a house sit on the market for weeks even in a ‘strong’ market?
The article says a long campaign can mean the home is overpriced, needs work, or is competing with too many similar listings nearby. In the example, the vendor was up against several near-identical homes within a short distance, which reduced buyer depth for her property.
If I’m selling, what should I check before setting my price?
Check the real DOM for your street and dwelling type, not just the suburb figure or agent appraisal. Also count how many competing listings are nearby, because local supply can make a campaign fail slowly and expensively.
As a buyer, what does a long days-on-market figure tell me?
It can show that a vendor may be under pressure or that the property has not been easy to sell. The article says the key is to find out why it has sat on the market, because that reason may help with negotiation or reveal a problem.
General information only. It does not take your objectives, financial situation or needs into account, and nothing here is legal, financial, taxation or investment advice specific to your circumstances.